Prediction – I predict that the enzyme will be at its optimum at around 600C and so it will become denatured around 700C. This means I should look at it more often the closer it gets to this temperature as the rate will go faster until the enzyme reaches its optimum temperature and then it will go slower until it becomes denatured, I expect this to be around 800C.
Fair testing – there are a number of things that I could do to make this a fairer test and to produce precise and reliable evidence, these are:
- instead of using one test tube I will use four test tubes and take the time of all of them and then take an average of the results I get. This will make it more accurate and it also means that there is less chance of me getting an anomalous result.
- when cutting the photographic film up I will make sure that cut it from the same section as the thickness of the protein glue may vary through out the full role of the film and so it will take longer to digest some parts than others.
Preliminary work – because I need precise results from this experiment I need to do a preliminary experiment to find out some details. I need to find out what temperature range I need to examine and what temperature the enzyme peaks at so I can watch it closer as it is getting faster. I also need to find what a good amount of enzyme to put in the test tube would be.
Theory.
Enzymes – optimum/denatured
Enzymes are organic catalysts, which means that they speed up the rate of reactions in living cells. Enzymes work in three areas:
Respiration
Photosynthesis
Digestion
In this particular experiment I will be looking how the temperature will affect enzymes that are digesting proteins. When enzymes are working there fastest it is called their OPTIMUM, for enzymes their optimum depends on two factors which are temperature and pH level of the solution it is in. This information is represented by the graph below.
Optimum Temperature
Rate of
Reaction
65
Temperature (0C)
The same graph can also be used to represent the optimum curve for the pH level of an enzyme. The graph shows that the optimum temperature for a particular enzyme is 37oC – this is its optimum temperature after this it becomes DENATURED.
Enzymes – shape.
Every enzyme has a particular shape, which is individual to it, this means that on enzyme can only digest on type of food, for example: -
PROTEASE PROTEIN
CARBOHYDRASE CARBOHYDRATES
LIPASE FATS
Lock and Key.
The enzyme digests the food molecule in the same way that a key opens a lock, only one enzyme can digest a particular food molecule.
Above is a diagram of how an enzyme works, the food molecule on the right is the perfect fit for the enzyme and it would be the only one of its kind so no other food molecule could fit this enzyme and vice versa. The red part of the enzyme is the active site. The active site binds the substrate and then the enzyme digests it.
Method-
- Collect the apparatus that is needed to do the experiment.
- Cut a strip of photographic film from the same area on the big role of film (the length should be about 40 holes on either side).
- Cut photographic film up into smaller pieces and thread them with a piece of wire that is longer than a test tube.
- Using a syringe put 2ml of the enzyme into each of the four test tubes.
- Put the pieces of film in the test tubes and start the timer.
- Check the each of the strips of film quite a lot and note the time when you can see that the piece of film has gone clear.
- When you have a time for each of the four test tubes then make an average and go and repeat the experiment using a water bath.
- When you have collected four times for each of the temperatures of water bath, plot the points on a graph.
Observation.
Measurements – to make the experiment fair I will repeat the experiment every 100C but starting at room temperature which is about 250C then 300C then every 100C after that. For each temperature I will use four test tubes, take the times of each then take an average, this will give me more results although I may get the odd anomalous result. I took this number of readings so my results would not be biased in any way, I also wanted to make sure I kept on repeating the experiment at higher temperatures so that I could find when the enzyme had denatured.
Apparatus –
- 4 Test Tubes (each time you do the experiment with a different temp. water bath)
- 1 Roll of Photographic Film
- 1 Test Tube Holder
- 4 Long Pieces of Wire
- Water Bath
- Enzyme
- Syringe
- Stopclock
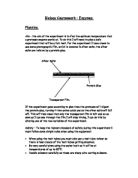
Diagram-
Test Tube
Wire
Analysing.
Results –
Rate (x10-3)
To change my results (which I had taken in seconds) to rate I used the following formula:
I took an average of each temperature and then plotted a graph. From my graph you can see that the two highest points are 500C and 600C, with this information I have repeated the experiment one last time and this then showed me that 550C was the optimum temperature for the protease enzyme. I then plotted another graph to show that 550C was the optimum temperature for the enzyme, these are the numbers I used to plot the two graphs.
Conclusion –
As the enzyme was heated more this meant that the particles got more energy and therefore moved faster. This then meant that there were more collisions happening between the enzyme and the food molecule, which means that it was getting digested faster. This is because every time they collide the enzyme will digest the food molecule.
The optimum temperature of the enzyme is the temperature at which the enzyme works best at, I found this to be 550C, after the enzyme reaches its optimum temperature it then denatures. This means that the enzymes cannot digest food molecules anymore, this is because the enzyme loses its 3-D shape and therefore cannot bind the substrate.
Evaluating Evidence.
Evaluation – The evidence that I have collected during the experiment I feel to be quite reliable as I kept the experiment as fair as I could with equipment and the help that was available. The curve on the graph is quite reliable but not perfect, it gives a good idea of what the perfect curve would look like. I have one or two anomalous results, I expect these are because I could only check one of the test tubes at a time which means that the salts may have fallen off in the last test tube but I was only getting round to checking the second test tube. This means that the average time for that temperature would be slowed down and so the rate would be lower and this would affect the graph. If I were to do this experiment again I would definitely use more test tubes and I would get more people to check the test tubes more often to give a more accurate result. To extend the enquiry I could do one of two things, I could find the optimum temperature for other enzymes such as carbohydrase and lipase, and I could use the result to see if there were any connections in optimum temperatures between all the enzymes. Another test I could do is to see what the optimum pH for the protease enzyme would be. To extend the experiment that I have already done I could find what I have recorded as the two fastest rate temperatures and do one last experiment. So if the highest two rates were 500C and 600C this would mean I should repeat the experiment at 550C, this should give me a more accurate optimum temperature.