Many variables effect osmosis. These variables include:
- Temperature
- Volume of sugar solution
- Concentration
- Weight of potato
- Surface area
I have chosen to change the concentration because I hope this will give me a good varied set of results to work with. The concentration will be measured in molars.
To make sure this is a fair test I will have to keep all the variables constant apart from the concentration. If I did change one of these variables, for example, if one potato chip were 1cm longer than the other there would be more space for osmoses to occur, therefore the test would not be fair.
To make sure the test remains fair I will do all my experiments at room temperature, use the same type of potato, which will be kept at the same size and weight and have been treated in the same way. I will also use the same volume of the solution in the test tube is kept fair. I will use an accurate electronic balance, showing grams to 2dp in this experiment, to ensure even small changes in mass are recorded. I will also keep using this balance throughout the experiment so measurements do not vary due to any change that may be introduced by different scales.
The water particles pass from a high concentration to a low concentration. I predict that the lower the concentration of the sugar solution in the test tube the larger the mass of potato will be. So in a high sugar concentration the potato will have a smaller mass.
This is what I think my graph will look like.
I will use a range of the sugar solutions from 0 molar to 10 molar in 2 molar steps. This should give me a good range of results to look at.
Apparatus
Apple corer – to cut circular potato pieces
Potatoes – to use to show osmosis
Kitchen towel – to dry potato pieces, so water does not make them weigh more, as this would not make it fair
5 test tubes – to put the solution in
Sucrose solutions – to put potatoes in, 5 different concentrations
Test tube rack – to put test tubes in
Pen, Paper and ruler - to record results
Electronic balance – to weigh potato pieces, gives a more accurate result than normal balance
Pipette – measure solution
Method
- Take 2 similar sized main-crop potatoes.
- Carefully use an apple corer to make circular sections approx. 2cms long.
- Wash and dry all the pieces
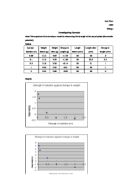
- Make a table to record results in. It should look something like this:
- Weigh each potato piece on an electronic balance and make sure they are a similar mass. Do this for 3 pieces at a time to ensure pieces for each solution do not get mixed up. You need to keep all the pieces together so you can keep track of which masses go into each test tube. This is important to keep the experiment a fair test.
- Take a test tube rack and place 5 test tubes in it. Label them 0 molars, 2 molars, 4molars, 6molars, 8molars and 10molars
- Using a measuring cylinder measure and pipette out different amounts of the sucrose solution and distilled water, which is poured into the test tubes in a percentage ratio giving you the various molar concentrations.
- Put 3 potato segments into each beaker and leave for 24hours.
- Dry with kitchen towel and re-weigh each segment on an electronic balance.
- Record the results then make an average.
- Re do using a second set of potato chips.
I have repeated the experiment to check for consistency and also because it ensures the results are fair and allows me to have a more accurate view on the changes. I have also worked out averages because I only require one set of results. As I was working with averages a control was not needed.
Results
First set of results
Second set of results
Average
As the sugar concentration went up the mass change became smaller. When the sugar concentration was 10molars there was only a mass change of 0.05g but when it was pure water the was change was 0.25g. I predicted that the lower the concentration of the sugar solution in the test tube the larger the mass of potato would be. This prediction was correct and the investigation did what I expected.
My results have a pattern, as the percentage of sugar concentration increased the change in mass decreased. Even though this was a pattern the decrease was not particularly large at any certain time.
In my opinion this experiment was very successful. I managed to obtain a large quality of accurate results from which I was able to produce an informative graph. I think I took the right amount of results but taking more would of made it more accurate. The 1day time period was enough time to allow osmosis to occur but I could of easily gained similar results in a shorter time span. If I were to repeat the experiment I would try and find out the saturation point of the potato pieces. I had an adequate but creating more concentrations is a possibility if I was to repeat this experiment as I could produce a wider range of results.
I found preparing the sugar solution the most difficult part of my experiment because I could never be 100% sure I was using accurate amounts. A more accurate pipette would have been useful. In future I could have used a burette, which would have ensured that the amount of solution in the tube was more accurate. I could of also weighed each potato piece to a more accurate scale i.e to three of four decimal places.
My results were fine even though the exact results were not persistent for both attempts at the experiment. This cause was properly human, I may not have dried some potato pieces as well as other, and some would then have more excess water adding to the mass. If I repeat the experiment again I will look into finding some other way of drying the potatoes more thoroughly. However I think the experiment was very successful and I am pleased with the complete comparison of my results with the initial prediction I made.