By making these changes my experiment should provide more reliable results that can be accurately analysed.
Prediction:
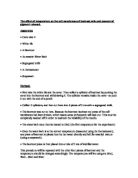
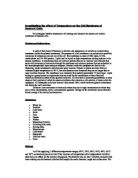
Having seen the results of my preliminary experiment and having used a couple of textbooks that showed me details on the structure of a cell membrane, I have formed a prediction that should correlate with my final results. The tonoplast membrane and the plasma membrane enclosing the cell both have the same structure: It is formed from a bilayer of phospholipid molecules, and these move around their own monolayer by diffusion. The bilayer is thought to be about 7nm wide. Membranes also contain proteins; some that traverse the membranes, others are either intrinsic or extrinsic, on the inside or the outside of the cell respectively. The structure of a membrane is known as the fluid mosaic model. Fig. 1 and Fig. 2 below show this model in detail. ‘Fluid’ refers to the fact that the phospholipid molecules and proteins move around within their layers bouncing off one another at a great speed. ‘Mosaic’ is used because the protein molecules that are scattered across the membrane give the appearance of a mosaic from above.
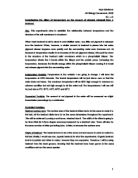
The phospholipid molecules are made up from a hydrophilic head (phosphate group) and a hydrophobic tail (fatty acid). These are shown in detail in Fig. 3 below. In the formation of the bilayer the hydrophilic faces outward towards outside the cell and into the cytoplasm, while the hydrophobic tails face inwards within the bilayer. The effect of this being that the tails are non-polar, so it is difficult for polar molecules, or ions, to pass through them, thus acting as a barrier to most water-soluble substances and controlling what passes into and out of the cell. It is also a similar situation with the proteins that exist in the membrane, as amino acid groups with hydrophobic side chains face inwards and vice versa.
Also shown in Fig. 2 are the cholesterol molecules in both layers. These too have hydrophilic heads and hydrophobic tails therefore slotting in well with the phospholipid molecules. The cholesterol helps regulate the fluidity of the membrane preventing it becoming too fluid or too rigid. This is important in maintaining the mechanical stability of the membrane.
In this experiment I predict that as the temperature increases the absorbency reading on the calorimeter will be higher. Thus an indication that more beetroot pigment will leave the cell through the two membranes. I think that this will be due to heat affecting the permeability of the membrane. From the result in my preliminary experiment I have deduced that more pigment will diffuse out of the cell at 80°C than at 40°C. I think this will be due to the higher temperature providing more kinetic energy thus meaning the phospholipid molecules move faster than they previously were. This movement creates gaps in the membrane for the betalain pigment to pass through allowing more to diffuse out from a high concentration within the cell to a lower concentration outside of the cell. I also predict that the increased temperature will lower the tensile strength of the membrane, so it may not be sufficient to withstand collisions from proteins and organelles within the cytoplasm and these may create holes in the membrane for the betalains to pass through, and the integrity of the membrane has been overcome. The heat will also provide more energy for the betalains to pass through the membrane. Thus I think the highest absorbency reading will be at 80°C, as the photons of light are absorbed by the betalains and the absorption of light decreases.
The graph drawn for my preliminary experiment’s results show a steep rise between 60°C and 75°C. I think this may happen again as the cholesterol in the bilayer is denatured. Due to cholesterol’s key role in maintaining the mechanical stability of the membrane, and from what I read about high temperatures denaturing cholesterol in Essential Cell Biology, I think that this high temperature around 70°C will lead to the full disassociation of the membrane causing the sudden rise in betalain pigment outside of the cell.
By analysing my preliminary experiment and looking through the Essential Cell Biology Textbook I gained a good idea about how membranes behave under different temperature conditions and the effect that kinetic energy has on the phospholipid molecules in the bilayer. I think that as lower temperatures are applied to the beetroot the lower the absorbency reading will be on the colorimeter.
The information about membranes and the ultrastructure of cells in the OCR BIOLOGY 1 Textbook was very helpful and provided a lot of details about the structure of membranes and the underlying reasons for this structure; the roles of cholesterol, proteins, glycoproteins, phospholipids and glycolipids in membranes; and explaining how molecules cross cell membranes. The information provided by this source really helped me to visualise how cell membranes function. I found much of the information about betalains on the website http://www- saps.plantsci.cam.ac.uk/records/rec82.html, it was very helpful in explaining what betalains chemically were and the function that they serve in beetroot. The site distinguished between anthocyanins and betalains, because betalains aren’t pH indicators. This website was a good source of information.
Visible using the electron microscope at very high magnifications of at least x100 000.
The bilayer is thought to be about 7nm wide.
Method:
From my preliminary experiment I have seen that temperature effects membrane structure and the amount of beetroot pigment that flows through it. So the independent variable, which I shall control, will be the temperature of the water bath which the beetroot slices are placed in. The dependent variable, which will change as the temperature changes, is the amount of pigment leaving the cell and this will be measured by the absorbance.
By carrying out my preliminary experiment and by looking over the method of a previous experiment similar to mine at the website: I have realized the importance of accurate results and carefully controlling the temperatures and times, to achieve this. That is why I have changed some equipment and parts of my method in order to accommodate this.
EQUIPMENT:
- Beetroot: 5 x 2mm discs/ sample
(In order to ensure all discs were of similar size and density all cylinders were cut with the No. 6 borer and were the same thickness, and were also from the same original beetroot. Beetroot used because it releases coloured pigment, betalain, which that can be measured for absorbency. Also slices are washed for several hours after slicing to remove any excess pigment that spilt out when the cells were cut.)
(Large enough to place sieve containing beetroot slices in without the hazard of tipping over the hot water. Also plenty of space for the 200cm³ of water within to be displaced without spilling over the edges.)
(Distilled water has had any impurities removed that may effect the final reading on the colorimeter.)
(To make sure that the temperature of the water bath is exactly what it is meant to be, in order that I produce reliable results.)
(Produces an exact amount of water to put in the sample pots. The amounts of water cannot differ from pot to pot as this would mean the concentrations of pigment differ and this would mean the absorbance readings would be inaccurate.)
(Measures the 200cm³ of water for the water bath to a relevant degree of accuracy.)
(Provide an air tight space for the beetroot pigment to diffuse in over 30 minutes and allow the final solution to be shaken without any leaking out before the absorbance measurement is taken.)
- Access to colourimeter set at 520nm/green (No.4 filter).
(Used to measure the absorbance, which is the value I shall use to compare my results against one another. It works as the photons of light are absorbed by the betalains and the absorption of light changes.)
(This allows the beetroot slices to all sit in the water for the same amount of time so they can be quickly removed. I found the time taken to remove the slices individually as a major source of error in my preliminary experiment.)
(Times exactly the time that the beetroot slices spend in the water bath and in their allocated sample pots, making the results more accurate and for the experiment to be a fait test.)
PROCEDURE:
-
Heat 200 cm³ of distilled water to 80°C.
-
Whilst water is heating place 10 cm³ of distilled water into 15 sample tubes labeling them like so: 80°C, 70°C, 60°C, 50°C, 40°C, and there are three pots to be labeled at each temperature. (The procedure is being repeated three times at each temperature so an average reading can be taken, thus making the results more reliable.)
-
Place 5 discs of beetroot into the sieve and place the sieve in the beaker of water at 80°C for exactly 1 minute. Then transfer the discs to the ampoule marked 80°C. Recording the time when the discs are placed there. (It is important that the discs spend exactly 1 minute in the water as this is the control factor for the experiment, and we can time exactly 30 minutes for the time they spend in the sample tube.)
-
Repeat the procedure two more times at 80°C with fresh discs of beetroot.
-
As the beaker of distilled water cools, repeat the procedure three times each for the other temperatures (70°C, 60°C, 50°C, 40°C) with fresh discs of beetroot.
- After the beetroot discs have been in their sample tube for 30 minutes, shake the ampoule and remove the beetroot discs. (It is important the tubes are shook equally because if the last remains of pigment are unequally distributed from pot to pot this could make the results less reliable.)
- At the end of the experiment there are 15 sample tubes containing relative amounts of red (betalain) pigment.
- Tare the colorimeter with a sample of distilled water.
- Using the syringe withdraw 6 cm³ of water containing the pigment from the pot and place it in the special colorimeter pot.
- Using the colorimeter measure the absorbance value for each temperature and record this in the table of results.
- Plot a graph of absorbance against temperature in order to analyse and compare the results.
HAZARD – HOT WATER, WEAR SAFETY GLASSES.
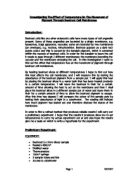
Results:
To work out the average I used the formula:
Σx
3
Working example from results at 80°C:
1.50 + 1.41 + 1.29
3
=1.40
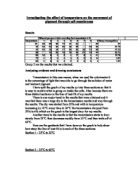
To plot the graph of my results I used the average value for the absorbancy. I put temperature on the x-axis, as it was the independent variable and absorbancy on the y-axis for the dependent variable.
To see the rate of beetroot pigment leaving the cell, I will measure the gradient at certain points of the curve. I have drawn the triangles onto my graphs and below I have calculated the gradients of tangents at two separate points of the curve.
Gradient= y1-y2
x1-x2
For triangle 1: 1.02-0.70 = 0.32 = 0.064
75-70 5
For triangle 2: 0.12-0.04 = 0.08 = 0.0076
60-49.5 10.5
Analysis:
The general trend shown on the graph is that as the temperature of the water bath increases, so does the value of absorbency from the colorimeter, which represents the amount of red pigment that has leaked out of the beetroot cell’s vacuole. As the temperature increases, more beetroot pigment diffuses through the tonoplast and plasma membranes to the water outside the cell. This shows that higher temperatures make the membrane more permeable by allowing more pigment to diffuse through.
For example at 80°C the absorbency value is 1.40 indicating a lot of pigment has diffused out of the cell, while at 40°C the absorbency value is just 0.04 indicating very little pigment has diffused through the membrane. By comparing these two results I can conclude that the membranes were more permeable at 80°C than at 40°C.
Both the tonoplast membrane and the plasma membrane are made up from a phospholipid bilayer. At 80°C, when the most red pigment has diffused out of the cell, the membranes were at their most permeable. As I explained in my prediction, the membrane is fluid and always on the move anyway, but with a high temperature there is more kinetic energy and the phospholipid molecules move around within their monolayer at a much faster rate and this can cause gaps to form in the membrane. The heat also means that the betalain molecules and other macro molecules in the cytoplasm having more kinetic energy and therefore having more powerful collisions with the membrane and this too can cause holes that allow more betalains to leave the cell, than would be leaving at a lower temperature.
I also think that the sudden rise in the gradient of the curve between 65°C and 80°C is due to more than just the increased movement of the phospholipids in the membrane. As I mentioned previously there are cholesterol molecules that exist within the membranes. Looking at the Essential Cell Biology Textbook I found that heat can denature cholesterol. Cholesterol is the key to the membrane maintaining its mechanical stability and it appears to have denatured at around 65°C as the membrane appears to really fail to hold much betalain pigment.
To summarise my analysis, as the temperature applied to the beetroot discs increases so does the absorbance value on the colorimeter. This is due to increased fluidity of the phopholipids molecules that make up the membrane and create gaps for the pigment to diffuse through. My results also appear to depict that above 65°C the cholesterol molecules denature and this makes the membrane far more fallible.
Evaluation:
To work out the reliability of my results I am going to calculate the standard deviation from the mean by calculating the values and plotting these on a graph. If my results are similar and there are no anomalies there should be a small standard deviation.
To work it out I used the following formula:
Σx² - x²
n
A worked through example of finding the standard deviation at 80°C:
1 x=1.50 2 x=1.41 3 x=1.29 Average=1.40
Step 1: Find x² for values 1x, 2x, and 3x.
Which are 2.25, 1.99, and 1.66 respectively.
Step 2: Find the sum of the x² values.
5.90
Step 3: Divide the value from Step 2 by the number of values, n, in this case,
3.
1.97
Step 4: Calculate the average value squared, x²
1.96
Step 5: Subtract 1.96 from 1.97
0.0074
Step 6: To get the standard deviation, square root the variant value from step
5.
0.09
I felt that on the whole the experiment went well and the procedure was accurate enough to produce reliable data, from which a conclusion could be drawn that matches existing scientific theory. There are some parts of the procedure though, that could have caused error and this was shown, especially at the high temperatures by quite a wide standard deviation. For example at 80°C the standard deviation was 0.09 compared to just 0.01 at 50°C. I think this was due to a couple of factors: Firstly, at 80°C, the water cooled at a greater rate than at 40°C, so during the one minute the beetroot discs were in the water bath the temperature decreased from 80°C to 78°C. Although this happened to all 3 repetitions at this temperature, I think it would be wiser in future to stop a fluctuation in temperature by insulating the water bath and placing a lid on it to prevent evaporation and convection. Secondly, I didn’t change the water in the water bath for the whole experiment so it contained an amount of beetroot pigment. This may have affected the diffusion of the pigment from a high pigment concentration within the cell to a lower pigment concentration outside the cell. As was shown with the results from 80°C; the first reading of absorbency was 1.50, but this became lower each time going from 1.50 to 1.41 to 1.29. I think this may have been due to there being more pigment in the water outside the cell so there was a lower concentration gradient drawing the pigment out. In future procedures, I would carry out each heating of the beetroot discs in fresh water baths.
At first I thought the results at 70°C and 80°C appeared as anomalies on the graph, but after some investigating realized the sudden rise in the rate of pigment leaving the cell may have been due to the membrane beginning to disintegrate and the cholesterol molecules becoming denatured. Even so, it appears there were a couple of anomalous results before the average was taken for each temperature. For example, at 80°C, 1.29 seemed a bit low compared to the other two results for that temperature, and at 70°C, 0.65, also seemed a bit low. There was a further anomaly at 50°C of 0.09 compared to the other two, which were 0.06. I think that these anomalies could have been due to what I mentioned above about the effect of changing the concentration gradient and they could also be due to different parts of the beetroot having different densities of cell, so the 5 discs for the anomaly at 50°C may have been far more dense than the other two sets used at that temperature.
It would also be interesting to find out whether the high temperatures had any effect on the chemical structure of the betalain pigment, and whether its viscosity changed at 80°C making it diffuse out of the cell easier.
I think the equipment I picked was good and served its function well, allowing the correct level of accuracy to be obtained. In a future experiment I might use an insulated water bath to prevent heat changes but other than that I would stick to the equipment, which I used. Because the colorimeter is such a sensitive piece of equipment, it was important that I treated the colorimeter pots well, being careful not to out any fingerprints on the sides of the pot through which light is shone to obtain the absorbency reading, and I would again check the pots were thoroughly cleaned for any future experiment. To increase the accuracy of the data, more readings could be taken in future, perhaps 5, to again narrow down the chances of an anomaly affecting the accuracy of the results.
In a future experiment I might also narrow down the range of temperatures to between 60°C and 80°C so a detailed analysis could be carried out into why there was such a sudden increase in pigment leaving the cell, and more thorough knowledge of the independent components of a beetroot membrane to help my understanding of my data.
There were some limitations to the experiment. The behaviour of the membrane could only be judged by the amount of pigment that diffused out. It would be interesting to know how the membranes behaved when no pigment diffused out even though there was no change in temperature. Another limitation was that we only saw the behaviour of the membrane in water which is a non-polar substance that attracts the hydrophilic head of the phospholipid molecule. It would be interesting to see the behaviour of the phospholipid bilayer in an organic solute or alcohol, and see if they have a different effect to water. This experiment was also limited because as the beetroot cells were placed in water they became turgid as they were affected by the high water potential of the water bath. This turgidity may have put extra pressure on the membrane so it wasn’t just temperature that might have affected the membranes tensile strength. I don’t know how this could be overcome in future, but its effect could be incorporated into the results by carrying out a control in just room temperature water and see what effect this had on the membrane.
I have pointed out the limitations of this experiment and also the positive points to it, and overall I believe the limitations didn’t have a great enough combined effect to make the data inaccurate and invalid, so to conclude, this experiment was successful as it allowed me to see the effect of heat on the permeability of the membrane.