Any change in pH affects the ionic and hydrogen bonding in an enzyme and so alters it shape. Each enzyme has an optimum pH at which its active site best fits the substrate. Variation either side of pH results in denaturation of the enzyme and a slower rate of reaction.
When there is an excess of enzyme molecules, an increase in the substrate concentration, produces a corresponding increase in the rate of reaction. If there are sufficient substrate molecules to occupy all of the enzymes’ active sites, the rate of reaction is unaffected by further increases in substrate concentration as the enzymes are unable to break down the greater quantity of substrate any quicker.
Inhibitors compete with the substrate for the active sites of the enzyme (competitive inhibitors) or attach themselves to the enzyme, altering the shape of the active site so that the substrate is unable to occupy it and the enzyme cannot function (non-competitive inhibitors). Inhibitors therefore slow the rate of reaction. They should not have affected this investigation, as none were added.
Enzyme Concentration – Provided there is an excess substrate, an increase in enzyme concentration will lead to a corresponding increase in rate of reaction. Where the substrate is in short supply (i.e. it is limiting) an increase in enzyme concentration has no effect.
Starch is a polymer of glucose monomers and is a mixture of amylose and amylopectin. Amylose makes up about 30% of starch and consist of unbranched chains in which the monomers are joined by 1,4 glycosidic bonds. Amylopectin makes up the remaining 70% of the starch molecule and consists of chains of glucose monomers linked with 1,4 glycosidic bonds and branches which are due to the formation of 1,6 glycosidic bonds at various points along the chain. Starch is designed particularly for its function as a storage compound. Starch is insoluble and therefore cannot move out of the cells in which it is stored. Starch is compact and does not take up much space. Starch does not become involved in chemical reactions inside the cell. The presence of starch can be detected by a solution of iodine. This reddish brown solution turns blue-black when starch is present. I know from previous experiments that this is an obvious result but it is not always easy to time the exact point when the entire blue-black colour has disappeared.
Amylases, which are enzymes, hydrolyse glycosidic bonds in polysaccharides such as starch as glycogen, converting them to dextrins (shorter length chains of glucose units) or to maltose. Amyloglucosidase hydrolyses the internal α-1,4 glcosidic links forming glucose. Pullulanase, which is also known as the debranching enzyme, hydrolyses the α-1,6 glycosidic links at the branching points of the polysaccharide forming dextrins.
Variables
Variables are parameters that can change. There are three different types of variables. The dependent variable is one that is measured. The independent variable is one that is manipulated. Control variables are kept constant. The independent variable was temperature, controlled during the experiment. The variable dependant on this was starch concentration. All other variables therefore had to be kept constant to ensure that the experiment was a fair test. These controlled variables were concentration of amylase and starch in the solution, time period over which the experiment was conducted and the volume of amylase solution and starch solution. The apparatus was also kept the same throughout.
- Starch concentration and volume must be the same throughout the experiment.
- Amylase concentration and volume must be the same throughout the experiment.
- The same concentration and size of drop of iodine must be the same throughout the experiment.
- Same volume of buffer solution will be used.
List of Apparatus
Amylase solution - enzyme
Beaker – to set up the water bath
Iodine – detects if starch is present
Distilled water - control
Pipette – get required volumes
Starch suspension - substrate
Stopwatch – measures time
Test tubes - hold the solutions
Thermometer – measures temperature
Risk Assessment
Throughout the experiment, safety precautions were taken to ensure that the experiment was conducted in a safe manner:
- Lab Coat and Goggles to be worn AT ALL TIMES during the experiment
- All substances must be in clearly labelled bottles
- Avoid inhalation in powder form Avoid contact with eyes. Wash thoroughly after handling.
- First Aid: In case of eye contact, immediately flush eyes with plenty of water for a few minutes. Seek medical attention if irritation develops or persists.
- Use eye protection – wash any spillage from skin with water as soon as possible.
- Iodine solution – can be toxic and irritant.
- Starch and Iodine solution:
Low risk since solution is not highly concentrated.
- Amylase – all enzymes have biological activity and need to be treated with care. If in powdered form avoid inhaling.
If any starch solution, iodine indicator or amylase was accidentally ingested, medical attention would be sought immediately.
Risk Assessment
· Lab Coat and Goggles to be worn AT ALL TIMES during the experiment
· All substances must be in clearly labelled bottles
Starch solution
very low risk, should be kept in labelled container
Amylase
Precautions:
Avoid inhalation in powder form Avoid contact with eyes. Wash thoroughly after handling.
First Aid: In case of eye contact, immediately flush eyes with plenty of water for at least 15 minutes. Seek medical attention if irritation develops or persists
Sodium Chloride solution 2%
Causes Eye Irritation
Precautions: Avoid contact with eyes. Wash thoroughly after handling.
First Aid: In case of eye contact, immediately flush eyes with plenty of water for at least 15 minutes. Seek medical attention if irritation develops or persists Iodine potassium iodide
Toxic and Irritant
Precautions: Avoid contact with eyes. Avoid direct contact with skin
Only use small quantities at any time
First Aid:
In case of eye or skin contact, immediately rinse with plenty of water for at least 15 minutes. Seek medical attention if irritation develops or persists
Glassware
Precautions:
As glassware will be used, the up most care to prevent breakage will be taken. This includes never placing cylindrical glassware on the bench where it is able to roll off. If glassware is broken then it should be cleared using appropriate equip ...
Pilot Study
In order to determine suitable concentrations that will give me a measurable result I am going to prepare a calibration curve.
Preparation of a calibration curve
-
Get five test tubes; pipette 5cm3 of distilled water and 0.25 cm3 of standard iodine solution. Mix thoroughly.
- Prepare a series of dilutions of the 0.5% starch solution:
- Quarter strength
- One-eighth strength
-
To the first tube containing the dilute iodine solution, add 0.25 cm3 of distilled water and mix well. Pour this into a cuvette and use this to set zero absorbance on the colorimeter scale.
-
To the second tube containing the dilute iodine solution, add 0.25 cm3 of one-eighth strength starch solution. Mix well and pour this into a cuvette and read the absorbance.
-
Repeat step 4 with the quarter strength and the half strength solutions. Lastly, add 0.25 cm3 of 0.5% starch solution to the remaining tube of dilute iodine solution, mix, and record the absorbance.
- Record your results in a suitable table.
Outline Method
-
Measure 30cm3 of 0.5% starch solution into a beaker and stand in a water bath at 200C.
- Pipette 10cm3 of the enzyme extract into a test tube and stand this in the water bath.
- Leave both the starch solution and the enzyme extract for 5 minutes to equilibrate to the temperature of the water bath.
- Pipette 5cm3 of distilled water into a cuvette and add 0.25cm3 of standard iodine solution. Mix well.
- When you are ready to begin the experiment, pour the 10cm3 of enzyme extract into the beaker of starch solution, leaving the beaker into the water bath. Mix thoroughly and immediately start a stopwatch.
- After 1 minute, remove one 0.25cm3 sample from the enzyme-starch mixture and add to the cuvette containing iodine solution. Mix by inverting the cuvette and measure the absorbance in the colorimeter. Record both the time and the absorbance.
- Discard the contents of the cuvette, rinse with distilled water, then replace with iodine solution as in step 4.
- Take further 0.25cm3 samples of the enzyme-starch mixture add to the iodine solution and record the absorbance at suitable time intervals such as 2, 5, 10, 12 and 20 minutes from the start of the experiment.
- Remember to check zero periodically during the experiment, using the blank prepared for the calibration curve.
Analysing Evidence
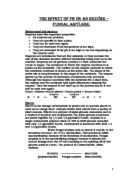
In order to show the effectiveness of the enzyme rather than the time it takes to digest the starch, the inverse of the time taken to digest the starch was plotted on the y-axis, with temperature on the x-axis:
The graph shows that, between temperatures of 20oC and 40oC, the efficiency of the enzyme increases with temperature. However, the graph between these points is a curve so the efficiency of the enzyme is not proportional to the temperature. Between 40oC and 60oC, the efficiency of the enzyme decreases with temperature, mirroring the first part of the graph. The graph shows that the optimum temperature of the amylase tested was 40oC.
The graph supports my prediction that the optimum temperature of the enzyme would be around 40oC, and would have decreasing efficiency towards 0oC, at which the amylase would be unable to break down the starch at all. However, the results did not support the prediction that, at temperatures over 40oC, the enzyme would begin to denature to an extent that, at temperatures much over 50oC, it would be totally ineffective. The reason why the enzyme seems to have been able to survive without denaturing at higher temperatures is that the enzyme used was a bacterial enzyme, and bacterial enzymes do not necessarily behave in the same way as enzymes from the human body. It therefore could have had an optimum temperature of slightly above 40oC, and did not fully denature until the temperature was raised to 70oC, as shown in the results table above.
It was impossible to test the prediction that, with time, the starch concentration would decrease for each temperature tested, showing exponential decay so that, after every x minutes, the starch concentration would half and would therefore never be totally broken down. However, the results did clearly show that the starch concentration decreased with time for all temperatures except when the enzyme denatured. If a graph could have been drawn showing the concentration of starch over time for each temperature, it would probably have been an exponential decay curve.
The reason for this behaviour of the enzyme shown in the graph involves theory concerning enzymes in general, amylase itself and kinetic theory.
Kinetic theory is the idea that, when a substance is heated, its molecules, having been supplied with energy, move around faster. In this experiment, as the temperature increased, the enzyme and starch molecules collided more frequently (Brownian motion) and with more energy which caused them to react more efficiently. At low temperatures, the molecules did not collide as frequently and the starch was therefore not broken down as quickly. This is true of any reaction, whether or not it involves catalysts, biological or otherwise.
The enzyme was most effective at 40oC because this is body temperature, at which is it most used to working. In order for it to function most efficiently in the body, amylase must have an optimum temperature of 40oC. The reason why the amylase was less effective at higher temperatures was that it had started to denature. All enzymes start to denature at temperatures above their optimum temperatures, which renders them unable of catalysing reactions.
Evaluating Evidence
The experiment worked well overall, proving beyond reasonable doubt that the optimum temperature of the amylase used in the experiment was around 40oC. Despite the erratic nature of the experiment, the results were sufficiently accurate that they were aligned almost perfectly on a curve, and were taken at intervals far enough apart that the readings were clearly distinguishable from each other.
However, the results were not totally accurate. For example, the first time the experiment was carried out at 70oC, the starch disappeared in six minutes, while the second time the enzyme denatured quickly. At 60oC, the second time the experiment was conducted at this temperature, the start took twice as long (12 minutes) to disappear. The graph was not a perfectly smooth curve, and this was due to several different factors.
The apparatus used could have been improved in many ways. The water baths used were not all at the exact temperatures required, and each contained a different amount of water. If better quality water baths had been used, and there was time to ensure that each had exactly the same amount of water and was at the exact temperature required, anomalous results could have been eliminated. This could also have been achieved by repeating the experiment for each temperature more than twice, and also by performing the experiment at intervals smaller than 10oC. Another problem with the experiment was the use of iodine. Although iodine is a good indicator of whether or not starch is present, it does not provide accurate information about the concentration of starch present. It would have been more useful to obtain this information so that it could be plotted, to analyse how the concentration changes over time rather than at what single time there is no more starch. This quantitative approach could have been achieved by using a colorimeter. This device provides an indication of how deep a colour is, and could have been used to measure the index of concentration of the samples throughout the experiment. Values for concentration of starch in the samples could have been obtained by first recording a reading for known concentrations, then comparing these readings with those obtained with the samples collected during the experiment.
Additionally, the pipettes used were another area of error. More accurate results could have been obtained by cleaning the pipette between each reading, or using a new pipette each time, but this could not practically happen. There was always some solution left over in the pipette from the previous reason. Another problem with the pipettes was that there was time for the amylase to act on the starch while the solution was in the pipette, making the timings recorded slightly too small. However, this effect was lessened with most of the temperatures as the mixture was cooling down to room temperature in the pipette. The method by which we tested to see if there was starch remaining did not work entirely satisfactorily. Maltose was mixed with iodine to give an indication of what colour the solution would turn when there was no remaining starch, and the resulting colour was yellow. However, with the samples collected, this colour was never reached and the readings were stopped after the solution turned a yellow/brown colour and stayed that colour. Had the experiment been undertaken with greater precision, it is likely that the yellow colour would have been reached. Finally, the procedure of preparing the solutions of amylase and starch for the experiment could have been improved. It is likely that there was some solution left over from the previous repetition of the experiment, making the starch/amylase ratio different each time. This could have been overcome by washing out the test tubes between readings. The volumes of each solution could have been made more accurate by measuring the solutions using a narrower gauge measuring tube or by using a syringe.
An ideal solution would have been to automate the whole system, with a sample of the mixture being automatically taken every minute, or preferably more frequently, and the concentration of starch stored on computer. This would have overcome the inaccuracies of the timing, which could not always be exact using a stop clock and someone watching it, and would have eliminated the effect of human error from the experiment. If these steps had been taken, it is likely that a graph more similar in shape to that suggested in the prediction would have resulted.
In conclusion, the accuracy of the results was certainly good enough to make a sensible conclusion. If the experiment had been conducted under more strict conditions and with more advanced instruments, the conclusion would not have been different although the individual results might have been more accurate and the graph might have looked very slightly different.
From graph 1, I can see that as the temperature of the mixture increases, the time taken for the amylase to digest the starch decreases. This happens fastest at 55OC, however if the temperature continues to rise then the time taken for the amylase to digest the starch rapidly increases. By the time 80 OC is reached the amylase does not digest the starch. From graph 2, I can see that as the pH of the mixture increases, the time taken for the amylase to digest the starch decreases. This happens fastest at pH 5. At a higher pH level than pH 5 the time taken for the amylase to digest the starch increases.
Amylase speeds up the breakdown of long chain starch molecules into smaller chains of maltose. Enzyme molecules have a very precise three-dimensional shape. This includes a ‘dent’, which is called the active site. It is exactly the right size and shape for the enzyme’s substrate to fit into (in the case of amylase this is starch). When a substrate molecule slots into the active site, the enzyme ‘tweaks’ the substrate molecule, pulling it out of shape and making it split into product molecules.
High temperatures make enzymes inactive: this is because they are proteins, which are damaged by temperatures above about 40OC. In this investigation it was found that amylase operated fastest at 55 OC and was damaged above this temperature. The enzyme is damaged because the molecules are moving faster, these bombard the active site of the enzyme changing its shape; when it’s shape has been changed then the starch will no longer fit in the active site and therefore cannot be digested. This is 15 OC above the suggested typical temperature, see Evaluating Evidence for possible reasons why it is higher than expected. By 80OC the amylase was completely denatured. From this information I can conclude that the optimum operating temperature for the enzyme amylase is 55OC.
Most enzymes work best at a pH of about 7. This is also because they are proteins, which are damaged by very acidic or very alkaline conditions. However in this experiment the amylase worked fastest at pH 5. This pH is lower than suggested above because the amylase provided by the school was a bacterial enzyme which had an optimum pH between pH 4 and pH 5.
In my design I predicted: that as the temperature increases, the speed of the reaction would increase. When a specific temperature was reached, I believed that the rate of reaction would dramatically decrease. I believed this because most chemical reactions happen faster when the temperature is higher. At higher temperatures molecules move around faster, which makes it easier for them to react together. Usually, a rise of 10OC will double the rate of reaction. This is true for enzymes up to about 40OC. However at 40OC the enzyme begins to be damaged, so the reaction slows down. By 60OC the enzyme is completely denatured. I predicted that the same would happen the further away the pH is from pH 7. I believed this because the optimum temperature for most enzymes is about pH 7 therefore the further away from pH 7 (either more alkaline or more acidic) the less effective the enzyme.
My results support most of the prediction since as the pH/temperature increases the rate of reaction increases until a point is reached and then the rate of reaction decreases. However, the optimum temperature was not 40 OC but 55 OC (unusually high) and the optimum pH was pH 5 not pH7. I also predicted that a rise of 10 OC would double the rate of reaction, this was not correct. As is evident in the table above, the time taken does not halve for every 10OC increase in temperature. I could not find a linear relationship between the temperature and rate of reaction, however with enough results (from a very large range of temperatures) a parabola could be made on Graph 1, it would then be possible to find a mathematical formula for the construction of the parabola and hence find the relationship between the temperature and rate of reaction. At current I do not have enough reliable evidence to draw any conclusions more specific than the rate of reaction is proportional to the temperature until 55OC is reached and after this point the temperature is inversely proportional to the rate of reaction.
Note: "Optimum operating temperature/pH" means this is the temperature/pH where the enzyme (amylase) operates the fastest.Evaluating Evidence
I believe that the experiment was successful but some of the results were unexpected/unreliable. The time taken for the amylase to digest the starch at 40 OC was far too fast (see Graph 1) it should have been between 4 and 4.5 minutes. All the other results seemed to fit into the trend on the graphs.
I believe that the experiment was designed well but there were a few problems. The optimum temperature for the amylase was too high. I believe that all the results were skewed because the enzyme was not given enough time at each particular temperature to be fully affected before it was added to the starch. Because of time restraints they were only left in the water bath for 10 minutes before starting the experiment. However, they should have been left in the water bath for about 30 minutes so that the amylase had been completely affected by the temperature before the experiment was started.
I decided to conduct the experiment at 10 OC intervals instead of 5 OC because there was not enough time. When the results were collected I plotted them on a rough graph to find the optimum temperature and then conduct the experiment at this temperature to ensure it was the optimum temperature. I also conducted all three experiments for each condition at the same time to save time.
Additional work, which could be carried out, is to repeat the experiment using, a wider range of temperatures and pH levels, a range of different starch solution concentrations or using different enzymes such as protease with a protein.