Biology AS Skills I, A & E
The effect of temperature on the rate of an enzyme catalysed reaction
By Rebecca Steptoe
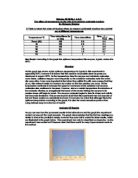
A Table to show the rates of reaction when an enzyme-catalysed reaction was carried out at different temperatures
Temperature/ ºC
Time taken/Secs (to nr 30s)
Time taken/Mins
Rate 1 .
Time /Min
Room (20)
65
5.5
0.2
30
50
2.5
0.4
40
20
2
0.5
50
90
.5
0.7
60
90
.5
0.7
70
60
See Graph: According to the graph the optimum temperature this enzyme, trypsin, works at is 80ºC.
Meaning
As the graph has shown us the optimum temperature for trypsin in this experiment is apparently 80ºC, however it is known that this result is not possible since enzymes are denatured at around 40ºC. As the temperature rises the enzyme and substrate molecules move faster, collisions happen more frequently so the substrate molecules enter the active site more often. Even more important is that when they collide it is with more energy that they do so; this makes it easier for bonds to be broken so that the reaction can occur. As the temperature continues to increase the speed of movement of the substrate and enzyme molecules also continues to increase. However, above a certain temperature the structure of the molecule vibrates so energetically that some of the bonds holding the enzyme in its precise shape will begin to break. The enzyme molecule begins to lose its shape and activity and becomes denatured. This proves beyond doubt that this experiment was not accurate or fair and these results are undeniably incorrect. It must also be noted that although this is the optimum temperature according to the graph, it is also the most anomalous point on line. Lying furthest away from the line of best fit.
The effect of temperature on the rate of an enzyme catalysed reaction
By Rebecca Steptoe
A Table to show the rates of reaction when an enzyme-catalysed reaction was carried out at different temperatures
Temperature/ ºC
Time taken/Secs (to nr 30s)
Time taken/Mins
Rate 1 .
Time /Min
Room (20)
65
5.5
0.2
30
50
2.5
0.4
40
20
2
0.5
50
90
.5
0.7
60
90
.5
0.7
70
60
See Graph: According to the graph the optimum temperature this enzyme, trypsin, works at is 80ºC.
Meaning
As the graph has shown us the optimum temperature for trypsin in this experiment is apparently 80ºC, however it is known that this result is not possible since enzymes are denatured at around 40ºC. As the temperature rises the enzyme and substrate molecules move faster, collisions happen more frequently so the substrate molecules enter the active site more often. Even more important is that when they collide it is with more energy that they do so; this makes it easier for bonds to be broken so that the reaction can occur. As the temperature continues to increase the speed of movement of the substrate and enzyme molecules also continues to increase. However, above a certain temperature the structure of the molecule vibrates so energetically that some of the bonds holding the enzyme in its precise shape will begin to break. The enzyme molecule begins to lose its shape and activity and becomes denatured. This proves beyond doubt that this experiment was not accurate or fair and these results are undeniably incorrect. It must also be noted that although this is the optimum temperature according to the graph, it is also the most anomalous point on line. Lying furthest away from the line of best fit.