Method
Apparatus:
Retort stand, Boss, Clamp, Boiling tube, small 100cm3 beaker, syringes (1ml and 5ml), 2 50ml measuring cylinders, stopwatch, water bath, delivery tube with bung, mortar and pestle, electronic weighing scales, 10 vol. hydrogen peroxide, liver [contains enzyme catalase], water, sand
Procedure:
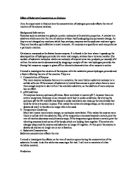
- I will set up the apparatus shown above.
- Using the electronic weighing scale, I shall weigh 10g of liver.
- Using the mortar and pestle, I will grind the liver with 20ml of water (measured using one of the measuring cylinders) and a pinch of sand (this helps the grinding process to work).
- When the enzyme is ground into a solution, I will pour it from the mortar into the 100ml beaker. [This solution I will use as 100%-concentration liver solution, even though some water has been added for grinding purposes.]
- I will place 4ml of hydrogen peroxide into the boiling tube (shown) with a 5ml syringe.
- I will take 1ml of liver solution using the 1ml syringe from the beaker.
- As concurrently as possible, I shall add the liver solution to the hydrogen peroxide, place the bung in the neck of the boiling tube, and start the stopwatch.
- When the volume of evolved gas reaches 40ml, I shall stop the watch, and record the time in a results table like the one below:
- I shall repeat the above 7 steps more times to produce an average, if there is enough time.
- I shall repeat the above 8 steps with the following concentrations of enzyme
Safety precautions:
I shall take care when handling the hydrogen peroxide, as the substance is poisonous. In order not to confuse beakers of water and hydrogen peroxide, I shall clearly label each of them.
I shall follow general lab procedures, i.e. no running; bags under worktops etc.
Obtaining Evidence
Degrees of accuracy
The table below shows how precisely each instrument was used. It does not show how accurately each item can give readings; it shows how accurately each item was interpreted or how precisely the reading was recorded. The stopwatch, for example, gave readings to @ of a second, which is far too accurate for human reactions.
Results
The following were all kept constant:
-
Temperature of experiment: 20° C (room temperature)
- Total volume of solution in test tube: 5ml
- Volume of enzyme (liver) solution: 1ml
- Volume of hydrogen peroxide: 4ml
-
Concentration of hydrogen peroxide: 10vol (1ml yields 10ml O2)
The following table shows the results for a varying enzyme concentration:
[As you can see, only one attempt at each level of concentration was performed. This is because the practical work was done within 80 minutes, and there was not enough time to repeat all the levels of concentration.]
Analysing evidence & drawing conclusions
GRAPHS:
The graph below [graph 1] shows the trend between the concentration of the enzyme solution and the time taken for 40ml oxygen to evolve. A computer has plotted the trendline, which is polynomial.
Graph 2 above shows us how the concentration affects the time taken to collect the gas, but it does not show the relationship between the concentration and the rate of reaction. The rate of any reaction is the speed at which products are formed. ‘Speed’, in other words, is displacement/time – or, in this case volume of gas displaced/time.
The table below contains the results from the experiment, and an additional column showing the rate of the reaction for each concentration. The data in the third column was calculated as follows: Rate = volume of gas displaced/time
As the volume of gas displaced is constant at 40ml each time, we can calculate the rate more simply by:
Rate = 1/time [The units are seconds-1]
The rate of reaction has been given to 2 decimal places in each case, because that is the most sensible degree of accuracy in this case.
Graph 2 shows the rate of reaction plotted against the concentration of the enzyme solution. A computer has plotted the trendline, which is linear:
Analysis
Graph 2
This graph shows how the time differs as the concentration increases.
The trendline is not a straight line passing through the origin (the criteria for direct proportionality).
It therefore simply shows us that the time taken for a set volume of gas to evolve decreases as the concentration increases. This is what I predicted, and these results support that prediction fairly well.
The science behind this was outlined in the justification for my earlier predictions, and it links back to the Collision Theory:
The time taken for the reaction to take place, or for the set volume of gas to be given off, becomes shorter for higher concentrations of enzyme. This is because higher concentrations of enzyme contain more enzyme molecules than the lower concentrations. If there are more molecules, then there are subsequently more collisions taking place over the period of a second (for e.g.). This means that more reactions between enzyme and substrate molecules take place in a second, and therefore the product (O2 in this case) is evolved more promptly.
So at higher concentrations of enzyme solution, the oxygen is given off more rapidly because there are more enzyme molecules working on substrate molecules in a second.
Graph 3:
This graph is very similar to the one procured for the justification of my prediction. It is a straight line through the origin, showing that x ∝ y, in this case: Rate ∝ Concentration
This was the outcome I predicted, which is again justified by the Collision Theory:
To increase the concentration of enzyme is to increase the number of enzyme molecules present in solution. More molecules mean more reactions taking place; twice as many molecules means twice as more reactions.
Therefore, if the concentration is doubled, the speed of the reaction also doubles. This means that:
Rate ∝ Concentration.
Anomalies
The rate against concentration graph does contain 2 points that are not on the straight line. These are at 20% and 80% enzyme concentrations. They are not excessively distorted, and do not affect any conclusions or analyses made.
Further investigation
The study of the enzyme catalase could be further investigated by analysing the effects of temperature upon the rate of the reaction between the enzyme and hydrogen peroxide. Although catalase can withstand reasonably high temperatures, it would probably denature at extreme temperatures. It would be interesting to investigate at what temperature it stops working.