FORMULA:
Catalase
Hydrogen Peroxide---------------------->Water + Oxygen
Catalase
CHEMICAL EQUATION: 2H2O2 -------------------> 2H2O + O2
It is able to speed up the decomposition of H2O2 because the shape of the active site matches the shape of the H2O2 molecule. In their globular structure, one or more polypeptide chains twist and fold, bringing together a small number of amino acids to form the active site-the location on the enzyme where the substrate binds and the reaction takes place. It will result in an enzyme-substrate complex to being formed. The enzyme will then break up the substrate into its simpler constituents. This type of reaction where a molecule is broken down into smaller pieces is called an anabolic reaction.
APPARATUS NEEDED
RISK ASSESMENT:
SIMPLE DIAGRAM OF EXPERIMENTAL APPARATUS:
METHOD:
To test out how the concentration of Hydrogen Peroxide affects the rate of reaction first set up the apparatus and prepare the different concentrations of H2O2 as below:
Throughout the experiment we will be using 10 cm3 of liquid all together.
The range will be from 30 volume to 0 volume. The 0 volume is used as a control to show that there is no reaction between the enzyme and no substrate.
Variables kept constant:
Control: To create a control for this experiment, we use the same amount of H202 but instead of adding carrots we would add water to show that H202 does not react by itself.
TRIAL RESULTS:
For this experiment some trials for which the concentration of hydrogen peroxide is to be used has been done and these were some results obtained.
Volume of O2 produced cm3) in 3 minutes Rate cm3/min
- Prepare the dilute solutions of the hydrogen peroxide using the volumes of liquid calculated out beforehand. The measuring cylinders used for distilled water cannot be used for hydrogen peroxide to prevent contamination.
* When measuring the volumes of water and Hydrogen Peroxide, the measurement
should be taken from a 90-degree angle to avoid parallax error.
- Grate out the carrots for a larger surface area for reaction.
- Measure out 1.5 grams of the carrots for the reaction
- Set up a retort stand to support the boiling tube
- Set up another retort stand to support the gas syringe
- Clamp the boiling tube with the solution to the retort stand
- Put in the grated carrots
-
Cover the boiling tube with mixture of H2O2 and carrots with a rubber bung with a delivery tube to deliver the gas collected.
- Start the stop-clock to time the reaction for 3 minutes
- After 3 minutes, measure how much oxygen has been collected and record it
- Repeat the experiment at least 3 times for each concentration to get more reliable
results.
Repeating the experiments several times will help to produce better and more accurate results, as any inaccuracies in one experiment should be compensated for by the other experiments. From these results, a graph can be plotted with concentration on the x-axis and the volume of gas released on the y-axis.
BIOLOGY T1 PRACTICAL:ANALYSIS
RAW RESULTS TABLE OF O2 collected when reacted with a % of H2O2
All results presented to 2 s.f. rounded off to the nearest whole number
-
The results are all written down to the nearest whole number on the gas syringe, because sometimes the gas syringe was moving so fast it could not be recognised if it was at 0.5 of a cm3.
Summary results table of O2 Collected Converted to Rate of Reaction
From these results, graphs of oxygen evolved and rate of reaction, the average without anomalies and the average with anomalies were plotted. The graph’s best fit line showed a slight curve towards the higher concentrations of 20 vol and 25 vol. When the concentration of Hydrogen Peroxide is increased, the rate of reaction increases at a directionally proportional rate until the concentration of H2O2 reaches about 20 vol where it started to slow down. It would have been expected that when the concentration doubled, the rate of reaction would too, but this did not occur. This was close to be true for the lower concentrations of 5 vol – 10 vol but towards the higher concentrations it did not happen. From 15 vol onwards the rate of reaction slowed down and increased by only a few cm3 compared to the lower concentrations and this is showed by the gradient on the graph going down. The substrate has formed enzyme-substrate complex with the active sites of Catalase in the carrot. At this point there was more substrate to let the enzyme work on but the Catalase present in the carrot was not able to work on the amount of substrate available and therefore the reaction slowed down making the active sites of Catalase saturated with H2O2. With an increase the concentration of H2O2, the number of substrate available increases hence, inducing a more violent reaction.
The results obtained did fit into the hypothesis and the obtained result graphs shape was identical as of the predicted graph. There was a slight curve and it started to level off at 15 vol. as did the predicted graph at higher concentrations.
The theoretical maximum rate of reaction is when all the sites are being used but this theoretical maximum is never reached because not all active sites are being used at the same time. The substrate molecules also need time to bind onto the enzyme and to leave it so that the maximum rate achieved is always slightly below the theoretical maximum. The time taken to fit into and leave the active site is the limiting factor in the rate of reaction.
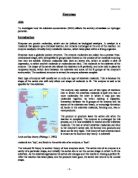
MODEL OF FINDINGS
Anomalies
There were some possible anomalous results obtained which did not conform to the first 2 result sets. These were at 83%, 67%, 50% and 17% concentration of H2O2. All these results were found in Set 3 but there were only slightly off the normal and this and the largest difference was 5 cm3 may be due to a number of reasons which include experimental errors like stopwatch mistiming or limiting factors:
- The Catalase in the carrots may have been contaminated or inhibited by natural inhibitors because of the exposure to air and Set 3 was the last set to be done and therefore was exposed to air the longest.
-
The H2O2 solutions prepared beforehand may have already decomposed a little because of exposure towards air.
Despite the fact that there were some possible anomalous results, the line of best fit still conformed to the general pattern predicted and the experiment was a successful one.
BIOLOGY T1 PRACTICAL: EVALUATION
Limitations
To enable this experiment to be completed as accurate as possible, I repeated each experiment three times and then used an average of all the results to best plot a graph with a line of best fit. There were some possible anomalous results and I did a graph with the possible anomalies and 1 without the anomalous results. I measured up the O2 produced by the reaction in 3 minutes and then found the rate of reaction. I tried my best to keep all the variables except from the independent variable which was tested (H2O2 Concentration) the same.
Unfortunately in practice it is impossible to do that with the basic apparatus I had to keep all measurements precisely the same. For example:
-
There is a slight delay between placing the grated carrots into the boiling tube of H2O2 solution. This will slightly affect all the results for each individual experiment but as I carried out all the steps in the same way, the difference would be negligible to the overall result.
-
It is not possible to precisely measure out the equal volumes of H2O2 and distilled water each time for each experiment. The scale on the measuring cylinder shows the measurement to the nearest ± 1mm3, the solutions that I used should be correct to the nearest mm3.
- One of the most inaccurate pieces of apparatus used was the measuring cylinder. This is extremely inexact because if the meniscus is not exactly on the line, the measurement would be wrong and this brings in a fairly large percentage error.
-
Instead of using a measuring cylinder a 10 cm3 calibrated pipette or a burette would have been far more precise pieces of equipment to measure accurate volumes.
- The gas syringe only had measurements for 1 whole number and this could have affected the results because no decimal places could be used.
- Although the carrot was grated to reduce the variation in Catalase content, the desired amount was still hard to measure because each part would have different concentrations of Catalase in it. There was no species variance because all the carrot samples used were from the same carrot.
- The water bath was difficult to keep at the constant temperature even if we use an electronic water bath due to heat loss to the surroundings more hot water would have to be added to heat it up again but this is an imprecise method.
- There was not a big enough range to do my results and although it could show a decreasing rate of reaction it could not show that the reaction stopped after a certain concentration.
- A beam balance with more decimal places would have made the results more exact.
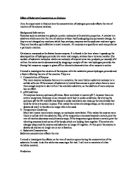
- A conical flask with a pressure line could have been used to show how far to push in the bung. This would have been attached to the bung which also connects to the boiling tube to the gas syringe with a delivery tube.
The results I obtained have conformed directly to my hypothesis and there is sufficient evidence to support the hypothesis. Although the Vmax was not reached, the general pattern of the graphs plotted conformed to the predicted graph.
Further Investigative work
- Even more repeats could have been done to improve the accuracy of the results.
-
The delay problem could be resolved by getting another person to bunge the test tube and start the stop-clock while the Catalase (carrots) were placed into the mixture of H2O2.
-
A larger range of results could be used for the experiment to clearly present the hypothesis, more concentrations at 40%, 60%, 90% & 95% to show that at the Vmax levels would be reached.
By doing these further investigative work, the Vmax can be shown and reducing the anomalies. A better overall result would be obtained by repeating the experiment more times because any errors in one experiment should be compensated for by the other repeated experiments.
BIBLIOGRAPHY