The lock and key hypothesis is the mechanism of enzyme action. Enzymes are proteins folded into a three-dimensional shape. The part of the enzyme that allows it to act as a catalyst is called the active site, which is shown on the next page.
This shows how the enzyme makes the substrate molecules react to form a new product. After this takes place, the enzyme remains the same, and repeats this process.
The enzyme lowers the amount of energy that is needed for the reaction to take place, making it much more likely to occur.
Several factors can affect enzyme activity, such as temperature. Higher temperature speeds up substrate molecules movement, causing them to have more energy when they enter the active site of an enzyme, making it more likely that they will bind. The enzyme molecules also gain energy with the rise in temperature, causing them to vibrate. At a certain temperature, the enzymes will vibrate so much that they become denatured – meaning that they will lose their 3D shape, and are unable to bind to their substrate. As a result, too high temperatures reduce enzyme activity. All enzymes have an optimum temperature, which is the point in which the enzymes are most active. Most enzymes in humans have an optimum temperature of about 37°C, but in most plants it is 25°C.
There are some molecules that change the possibility that an enzyme will bind to its substrate. Those that make it more likely are called activators, e.g. chloride ions are a necessity for binding salivary amylase. Those that make it more difficult for an enzyme to bind to its substrate is called inhibitors and makes it more difficult to bind to a substrate, an example of one of these is cyanide ions block the active sites of enzymes involved in respiration.
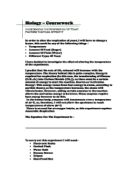
Apparatus
This experiment requires several pieces of equipment, which are as follows;
Test-tube rack,
2 test-tubes,
Large flask of yeast,
Large flask of sucrose,
2 measuring cylinders,
Plastic beaker,
2 polystyrene cups,
Thermometer,
Bung,
Delivery tube,
Gas collection cylinder with tube,
Clamp,
Large beaker of water,
Kettle,
Stirring rod.
Below is a diagram of how the apparatus should be set up.
Preliminary Method
For this experiment I will stir the yeast solution before adding 10cm3 of it to a test-tube, while using a measuring cylinder to get the correct amount in it, as this mixes all the particles that have settled on the bottom of the flask. Next I will put the test-tube in a test-tube rack so it won’t topple over or spill. Then I will put 10cm3 of sucrose in a measuring cylinder and then set up the rest of the equipment. First I will place the polystyrene cup inside a plastic beaker that will make it more stable. A polystyrene cup is used because it insulates water inside it, making it lose temperature more slowly, meaning that it will be easier to keep at a constant temperature. My range for my preliminary will be from 20°C to 60°C, at 20°C intervals. For the first one, no water needs to be added to the cup as this is at room temperature. I will then put the test-tube into the cup, and then add the sucrose to it. Next I will place the bung on it like in the above diagram, and then I will start the stopwatch, and allow the experiment to go for 5 minutes. During this period, I will prepare for the next temperature, and prepare the yeast and sucrose as above. When the first test is over I will increase the temperature by adding some warm water to the cup from the kettle, to get it to he right temperature. In order to keep the temperature the same throughout the experiment, I will pour some of the hot water into a separate cup, so that I can pour some into the cup if the temperature should fall below a certain point. This should help to keep it a fair test.
Safety is always a priority, and it is no different in this case. In this experiment there are no hazards to be wary about, other than the water from the kettle. To stay safe while pouring it, I will place the cup on the desk, and pour the water in slowly. I will also keep my bag out of the classroom, and the chairs under the desks.
Prediction
I predict that as the temperature is raised, then so will the rate of respiration. I believe that this will continue to happen up to an optimum temperature, at which the active sites of the enzymes will begin to denature. I believe this because of the information given earlier in this piece of coursework.
Preliminary Results Table
From assessing the above data, I will do several things to improve my experiment. I will repeat each variable once more, so as to make sure that my results are accurate and reliable. I will also use the same range of results, but instead I will do it at 10°C intervals. This will give me more results, and make it easier to analyse and evaluate. I will also use 15cm3 of yeast and of sucrose, as this may make my results more reliable. I will also run the experiment for four minutes instead of five, as five minutes is too long to run them, and four minutes will most likely give just as reliable results.
Obtaining Evidence
The experiment seemed to go well, and there was no problem when it came to collecting the data required for this part of the coursework.
Table of Results
Averaged Results Table
Adding the two results for each test, and then dividing it by two found the above results.
The rate of respiration is found by dividing the average amount of carbon dioxide produced by the time allowed for the reaction to go on for, which, in this case, is four minutes.
Rate of Reaction Table
There appears to be one anomalous set of results, which is those at 30ºC. I believe this because although the temperature has increased, there is no carbon dioxide produced. I also believe this to be anomalous because the result at a lower temperature produced some gas.
Analysis
The results obtained in the experiment show that the optimum temperature is around 50ºC. My results show that as temperature increases, the rate of reaction also increases, until it reaches an optimum temperature. At this point, the rate of respiration decreases.
There is an obvious trend in the graph on the previous page. The graph shows that as the temperature is increased, the rate of respiration also increases. This continues to occur until the optimum temperature is reached, which, in this case appears to be about 50ºC. After this point, the rate of respiration soon starts to decrease. The reason for this is that the active site starts to denature, which means that the substrates can no longer bind in the enzymes active site.
At 20ºC and 30ºC the rate of respiration is very low, and doesn’t exceed 0.0625cm3/min. This is because the enzymes didn’t vibrate enough because they didn’t gain much energy for the heat of the water. As the temperature increased, so did the rate of respiration, reaching an average of 0.6250cm3/min at 40ºC. Between 40ºC and 50ºC, the respiration rate increased dramatically, rising from an average of 0.6250cm3/min to 3.2500cm3/min. This is an increase in rate of 2.6250cm3/min. The reason behind this dramatic rise in rate of respiration is because the enzymes and the substrates gained a lot of energy form the heat of the water in the cup. Between 50ºC and 60ºC, there was a drop in the rate of respiration of 0.5000cm3/min. This is because the enzyme and the substrates had too much energy at this temperature, and vibrated too much. This caused the enzyme’s active site to start to denature, and the substrates couldn’t bind as much with the active site.
This data and graph support my prediction, as an optimum temperature has been reached, and there is a clear trend when looking at the graph. It is clear that from looking at the graph that the rate of respiration increases with its temperature. After the optimum temperature is reached, the active site denatures, and the respiration rate of the yeast decreases.
Evaluation
The procedure went well, and all obtained results appear to be accurate, reliable, and support my prediction. This experiment worked well and my aim of discovering how varying the temperature, of a solution of yeast and sucrose, would affect the amount of carbon dioxide produced during a set time period. I believe this experiment to be worthwhile because I now have evidence to support my prediction, and also the background information I gave earlier.
The quality of my evidence is, overall, accurate and also reliable. This is because they follow scientific theory like the ‘lock and key hypothesis’ and the Collision Theory. It followed my prediction that was based on scientific theory. The results follow the expected pattern, which has reaches optimum temperature and then, when it starts to denature, the respiration rate falls. There was one set of anomalous results obtained in this experiment. This was when the temperature was at 30ºC. I believe these results to be anomalous as the do not follow scientific theory. At this temperature, the rate of respiration does not increase from the first set of results, which were at 20ºC. According to the lock and key hypothesis, a rise in temperature should increase the rate of respiration. This is not the case with this set of results. The rest of the results do, however, follow theory.
On the next page there is a table commenting on how the experiment could be improved in order to gain more accurate results, and minimise the risk of anomalies.
The data I’ve collected is sufficient to draw the conclusion that my prediction was correct.