attempt to measure each separately. Here the religion
categories are
aggregated regardless of ethnicity. For example, the
`Muslim' group contains
Pakistani, Bangladeshi, Indian and other Muslims. Also
included are
`foreign-born' and `British-born' non-white variables.
These variables measure
any ethnic disadvantage and indicate the importance of
race over and above
religion. The insignificance of the British-born
non-white variable might be
thought to indicate that the labour market situation
of second-generation
non-white migrants has fully assimilated to that of
British-born whites, on
average (following Heath and McMahon 1997, and Leslie
et al. 1998). The
insignificance of the foreign-born variable would
indicate no differences
between first-generation non-white migrants and
whites. Both modes are
corrected for employment selectivity (see Heckman
1979). In subsequent
discussion and tables, these are referred to as Model
1 and Model 2.
Descriptive statistics
Table 1 provides the ethnic composition of the various
religions in the
sample. One can see that Muslims mainly consist of two
groups, Pakistanis and
Bangladeshis, with a smaller percentage of Indians and
African Asians. (11) As
a result, Muslims can be disaggregated into Pakistani,
Bangladeshi, Indian and
other Muslims; this last category consists mainly of
African Asians and a very
small percentage of whites. Hindus can also roughly be
divided into two
groups. These are Indians and African Asians, with the
latter group containing
a small number of others. Sikhs are mainly Indians and
are therefore not
disaggregated further. Christians can be roughly split
into two groups: white
and mainly Caribbean. The `other religion' category
consists of Buddhist,
Jain, Rastafarian, Jewish, Parsi/Zorashia and others.
The ethnicity of this
`other' religious group is too diverse to disaggregate
further. Finally those
with `no' religion are about 60 per cent whites, 20
per cent Caribbean and the
rest are Chinese or other. It is noteworthy that more
whites have no religious
views compared with the other ethnic groups.
Table 2 presents some descriptive statistics
concerning the religious
affiliation of the sample by labour market status and
sex. The sample sizes
refer to everyone over the age of 16 and under the
statutory retirement age
and are unweighted. (12) The second column in Table 2
shows the percentage of
each religious group employed. For both men and women,
Muslims have a much
lower percentage employed than the other groups,
although there are
significant differences within the Muslim category.
The percentages of
Pakistani and Bangladeshi Muslims employed are very
low in comparison to all
the other groups. Also Hindu Indians appear to have a
much higher percentage
of employed than Indian Sikhs, Indian Muslims and
African Asian Muslims. This
is evidence that religion rather than race is the
important discriminator. In
fact, Indian Hindu males have a greater percentage of
employed than all the
other non-white religious groups.
The third column shows the percentage of the sample
who are unemployed. As
might be expected, these are much higher for males
than for females. Hindu and
white males show the lowest unemployment rates. The
fourth column refers to
the percentages of the sample who are `out of
employment'. These are
particularly high for Muslims and especially for
women. Interestingly, white
Christians appear to do better on this measure than
those with no religion.
The final column provides average weekly earnings for
those who are employed.
In general, Muslims earn considerably less than the
other groups. Amongst the
Muslims, Bangladeshis demonstrate the lowest average
earnings, whilst
Pakistani males and other Muslim females earn the
most. Again there are
significant differences in the earnings of Indians,
since Hindus and Sikhs do
better than Muslims. For males, those with `other'
religion earn the most, on
average, followed by white Christians, whites with no
religion and Indian
Hindus.
For females, those with some other religion earn the
most, whilst Bangladeshi
women earn the least. Interestingly both Christian and
non-religious non-white
women earn more, on average, than their white
counterparts. The reverse is
true for males. This provides some evidence of a
matriarchal culture, amongst
Caribbeans, where the female adopts a more dominant
economic role; see
Berthoud and Beishon (1997) for further discussion on
this. In addition, this
demonstrates that ethnic differences exist within
religious categories.
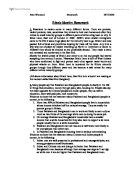
The results
[Graphic omitted]Table 3 shows key results from
employment/unemployment
probits for males and females. (13) These include a
standard set of
independent variables measuring human capital and
other socio-economic
characteristics as well as religion. (14) The first
two columns refer to the
first model, whilst the second two columns refer to
the second model. Model 1
includes religion with the ethnically disaggregated
categories, whilst Model 2
includes religion and ethnicity variables. All results
are relative to whites
with no religion.
Looking at Model 1 in the first two columns, religion
is an important
determinant of employment for both men and women. (15)
The most notable
differences are between the Indian religions, whilst
the most disadvantaged
group appears to be Muslims. Sikhs are the only Indian
males to display a
reduced propensity for employment, relative to those
with no religion. Amongst
the male Muslims, only Pakistani males exhibit a lower
propensity for
employment. This confirms the findings of Brown
(2000). Interestingly males of
some other religion are less likely to be employed and
white Christian males
are more likely to be employed, relative to whites
with no religion. This of
course may in part reflect some unmeasurable
socio-economic factors. A similar
story holds for females, except that Bangladeshi
Muslim females are also less
likely to be employed.
The final two columns refer to Model 2. This contains
the aggregated religious
groups (regardless of ethnicity). Also included are
separate `foreign-born'
and `British-born' non-white variables. The
significance of these variables
would indicate an ethnic penalty over and above
religion, where the reference
category is non-religious whites. It should be
remembered that there are a
large number of whites in the Christian category and
hence there is a
comparison to be made here also.
All Muslims and male Sikhs display significantly lower
propensities for
employment, whereas Christian males demonstrate higher
propensities for
employment, relative to those who are not religious.
This further demonstrates
the importance of religion. For both males and
females, being Muslim implies
the biggest employment penalty. For non-whites, being
British-born non-white
(regardless of religion) also implies a lower
propensity to be employed.
Interestingly, foreign-born non-white males appear to
do better than
non-religious whites, although they do significantly
worse than Christians
(who have a high percentage of whites). (16) For
females, the Muslim religion
is important, although ethnicity is not. There is no
significant employment
penalty to non-fluent non-whites, over and above this
Muslim effect. (17)
In the light of Table 3, one might want to measure the
religious and the
ethnic penalties. Since Table 3 shows the Hindu
variable to be insignificant,
then the religious focus here is on Muslim and Sikh
penalties. To do this, a
counterfactual analysis can be undertaken that
predicts what average
employment rates would be if there were no Muslim
penalty or no Sikh penalty
to non-whites on the basis of the coefficients from
Model 2 in Table 3. These
predicted average probabilities can then be compared
with the actual average
employment rates. This gives a measure of the overall
Muslim and Sikh
penalties to non-whites. In addition to this, average
employment rates can be
predicted by imposing the additional restriction that
there is no ethnic
penalty to employment. This roughly isolates the
Muslim, Sikh and ethnic
penalties, so that the remainder gives the difference
accounted for by other
characteristics. The relative magnitudes of the Muslim
effect, the Sikh
effect, the ethnic effect and the characteristic
effect can then be compared.
Table 4 presents these comparisons. Each cell contains
two figures. The first
refers to the employment/unemployment dichotomy of
Table 3, whilst the second
(in square brackets) refers to an employment/out of
employment dichotomy. The
first row shows the total difference in unemployment
rates, so for example
whites enjoy a 21.5 per cent lower unemployment rate
based on the average of
the predictions from Model 2 in Table 3. For males,
non-white unemployment
falls by 5.1 per cent should all in the sample be
non-Muslim, whilst it falls
a further 1 per cent should all be non-Sikh. The
fourth row shows that the
male non-white employment would fall by 11.0 per cent
if all in the sample
were white. Hence the ethnic penalty (at 50 per cent
of the total
differential) is far greater than the religious
penalties (30 per cent
combined) and indeed that explained by differences in
other characteristics
(20 per cent). Here other characteristics include
English language fluency. So
there exists a relatively large racial discrimination
or non-assimilation
effect over and above controlled characteristics, even
when religious
association is included within the analysis.
Looking at females, there is a noticeably smaller
white/non-white unemployment
differential than that for males. The religious
penalties are quite similar to
those for males (at 34 per cent of the total
differential), although the
ethnic penalty is also noticeably smaller (at 17 per
cent). Most of the female
non-white unemployment penalty can be attributed to
differences in
characteristics (49 per cent).
A further interesting picture is provided by the
female `out of employment'
differential. Unlike those for males these provide
quite different results.
The `out of employment' differential is much larger
for females than is the
unemployment differential. Second there is no ethnic
penalty over and above
religious effects. In fact there is a penalty to white
women of 21 per cent of
the total white/non-white differential. After
differences in other
characteristics (which account for 69 per cent), the
only other penalties are
explained by differences in religion. This is
especially high for Muslim women
(at 43 per cent). This provides evidence to support
increased female
non-participation as a direct result of Islamic faith,
relative to the other
religious groups.
Table 5 shows the key results for employment
selectivity adjusted earnings,
(18) Again all results are relative to whites with no
religion and the first
two columns refer to Model 1, whilst the second two
columns refer to Model 2.
Looking at the first model, one can see that there are
significant differences
between Indian males, with only Sikhs demonstrating a
significant earnings
penalty. (19) All Muslims display an earnings penalty,
with Bangladeshis
experiencing the highest, followed by other Muslims
(mainly Indian and
African) and Pakistani Muslims. The second column
refers to female earnings.
The only females who experience an earnings penalty
are those who are not
fluent in English.
The final two columns refer to Model 2. Only Sikh and
Muslim males and white
Christian women exhibit significantly lower earnings,
whilst males with
another religion exhibit higher earnings, relative to
those with no religion.
For males, there is a significant earnings penalty to
immigrant non-whites
regardless of their religion. This provides evidence
of a foreign-born ethnic
disadvantage (but not a British-born one) which is
over and above religion and
English language fluency. (20) Of course this could
suggest that British-born
non-white earnings are assimilating to those for
whites. For females there is
an earnings premium to British-born non-white females,
relative to white
non-religious females. This further supports the
assimilation of earnings.
Only white Christian females and those non-fluent in
English experience
significantly lower earnings, relative to those with
no religion.
The final row in Table 5 shows the correlation
coefficients between the error
terms of the employment selection equation and those
of the earnings equation.
These show that the correlation coefficients are
insignificant for males and
significantly negative for females. For males this
suggests that correcting
for selectivity has only a marginal effect on the
estimated parameters in
Table 5. For females, earnings would be higher for
those who are unemployed,
should they gain employment, relative to those who are
already in jobs.
Blackaby et al. (1999) suggest that this occurs since
the unemployed have
higher reservation wages than the employed and in turn
would require a greater
reward to enter into employment.
Islamic disadvantage
Clearly Tables 3 and 4 provide little evidence of
ethnic assimilation in
unemployment rates. Furthermore, Muslims are the most
disadvantaged of all the
groups. It would be interesting to know how much of
this disadvantage is a
direct result of differences in characteristics of the
group and how much is
the result of other factors such as anti-Islamic
discrimination and
differences in the attitudes and aspirations of
Muslims, relative to other
ethnic religions.
By estimating a separate employment probit equation
for Muslim and non-Muslim
non-whites, the Gomulka and Stern (1990) method can be
used to decompose
unemployment differences into a characteristics
component and a coefficients
component. The analysis leads to two alternative
decompositions, which are
(1) [I.sup.NM] - [I.sup.M] =
[bar]P([[alpha].sup.NM][X.sup.M]) -
[bar]P([[alpha].sup.M][X.sup.M])] -
[[bar]P([[alpha].sup.NM][X.sup.NM] -
[bar]P([[alpha].sup.NM][X.sup.M])]
(2) [I.sup.NM] = [I.sup.M] =
[[bar]P([[alpha].sup.NM][X.sup.NM]) -
[bar]P([[alpha].sup.M][X.sup.NM])] -
[[bar]P([[alpha].sup.M][X.sup.NM]) -
[bar]P([[alpha].sup.M][X.sup.M])]
where NM refers to non-Muslim and M refers to Muslim,
with [[alpha].sup.M] and
[[alpha].sup.NM] the vectors of estimated coefficients
from the probit
equations, [I.sup.NM] and [I.sup.M] are the respective
predicted average of
the employment probabilities of group NM and group M.
(21)
[bar]P([[alpha].sup.M][X.sup.M]) is the average across
the sample of the
predicted probabilities using group M coefficients and
group M characteristics
and similarly for the other terms. The first term in
square brackets measures
the difference in means due to differences in
coefficients and the second term
the differences arising from differences in the
individual characteristics of
group M and NM. Equation (1) decomposes around average
group M characteristics
and equation (2) decomposes around average group NM
characteristics. Because
non-whites are split according to whether they are
Muslim or not and ethnic
controls are included as regressors, coefficient
differences can be identified
as the pure `Islam' effect. In this way it can be
investigated whether Muslims
are additionally penalised in having poorer average
characteristics, which
contribute to a lack of employability.
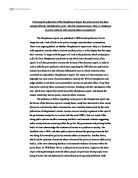
[Graphic omitted]Table 6 presents a summary of the
Gomulka-Stern
decompositions. The first set of figures in the
columns show the decomposition
for the employment/ unemployment dichotomy, whilst
those in square brackets
show the larger sample of those in employment or `out
of employment'.
The first row of Table 6 confirms that Muslim
non-whites are disadvantaged
relative to non-Muslim non-whites in terms of
unemployment rates. The female
Muslim unemployment penalty is everywhere greater than
that for males. One can
see that Muslim males display a greater unemployment
penalty, whereas Muslim
females demonstrate a greater out-of-employment
penalty. For both men and
women, there is a substantial component of the total
non-Muslim/ Muslim
differential that can be attributed to differences in
coefficients. However,
the coefficient (unexplainable) component is greater
for male unemployment and
female out-of-employment. This substantial
`unexplainable' component can be
attributed to being Muslim, although one should take
care in labelling this
entirely as `Muslim discrimination'. This component
may contain other cultural
and attitudinal differences, for example the Muslim
tradition whereby there is
no expectation that women should engage in market
economic activity. Moreover,
there is a strong characteristic effect and this is
especially large for
Muslim women. This includes such things as poor
English language fluency and
undervalued overseas qualifications. Such
significantly lower
employment-enhancing characteristics suggest labour
market assimilation
problems amongst Britain's Muslims.
Concluding comments
This study builds on Brown (2000) by including whites
in the sample for
comparative purposes. The results confirm those found
in Brown (2000) and have
shown significant differences within ethnic groups,
depending on religious
association. The most notable of these differences
applies to Britain's Indian
population. Hindu Indians appear to fare better in the
labour market than do
Sikhs. As a result, local changes in the labour market
will have different
implications for Indian communities, depending on
whether they are Sikh, Hindu
or Muslim. Second, this study has shown that Muslims
and Sikhs generally
experience greater labour market disadvantage
regardless of ethnicity. So it
would seem that religion is an important issue, as
well as ethnicity.
Unlike Brown (2000), this study controls for religion
and ethnicity
separately. The results demonstrate that religion
alone cannot fully explain
the difference between white and non-white
unemployment. There is evidence of
unemployment disadvantages to British-born non-whites
over and above
differences in religious affiliation. Moreover, the
results suggest that both
British- and foreign-born non-whites do worse than
most whites, in terms of
employment prospects. (22) For earnings, lack of
fluency and religion appear
to be the dominant factors (rather than ethnicity) in
terms of determining
average weekly earnings. Only foreign born non-white
males experience a
significant earnings penalty over and above religion.
Since there is no
earnings penalty to British born non-whites once
religion has been controlled
for, this provides some evidence of non-white earnings
assimilation towards
those of whites.
[Graphic omitted]Gender differences are also apparent.
Unemployment
disadvantage is more important for ethnic minority
men, whereas non-white
women exhibit a greater propensity to be `out of
employment'. Given that
ethnic and religious differences exist in the
attitudes towards female labour
market participation, one cannot directly ascribe this
observation to
discrimination. Interestingly though, nonfluent
females tend to be penalised
in terms of lower earnings, rather than through
employment prospects. There is
no unemployment disadvantage to non-fluent females,
although there is a
significant earnings penalty. In short, the results
for females further
support the assimilation of ethnic earnings, whilst
highlighting non-fluency
in English as an important determinant of observed
ethnic labour market
disadvantage.
Finally, this study shows that Muslims do experience
some unexplainable
employment penalty, relative to other non-white
religions, over and above all
other characteristics (including ethnic differences
and language fluency).
This supports the existence of religious
discrimination towards Muslims,
although such unexplained differences may well contain
unmeasurable components
such as motivation and attitudes towards employment.
Again this is especially
true for Muslim females who are `out of employment'.
To ensure equal
employment opportunities to all ethnic groups,
employers should be prohibited
from indirect racial discrimination. Religious
discrimination can occur
through the failure to allow for individual religious
requirements such as
prayer facilities, dress requirements, and the
requirements of religious
festivals such as fasting etc. Approximately half of
the Muslim/non-Muslim
unemployment differential can be explained by
differences in characteristics.
Hence Muslims appear to be less assimilated and/or
have less transferable
human capital than other non-whites.
Table 1. Religion and ethnicity of the FNSEM sample
Ethnic groups
Religious group Males Females
Muslim 51% Pakistani 53% Pakistani
34% Bangladeshi 32% Bangladeshi
7% Indian 7% Indian
7% African 7% African
1% Other 1% Other
Hindu 56% African 52% Indian
41% Indian 46% African
3% Other 2% Other
Sikh 80% Indian 84% Indian
20% African 16% African
Christian 61% White 60% White
31% Caribbean 35% Caribbean
7% Other 5% Other
Other religions 31% Chinese 38% Chinese
23% Caribbean 23% White
23% African 10% Caribbean
23% Other 10% African
19% Other
No religion 59% White 62% White
27% Caribbean 21% Caribbean
8% Chinese 9% Chinese
6% Other 8% Other
Note: `Other religion' consists of 39% Buddhist, 17%
Jain, 12%
Rastafarian, 6% Jewish, 2% Parsi/Zorashia and 24%
other
religion.
Table 2. Descriptive statistics on religion, FNSEM
sample
Average
weekly
Un- Out
of earnings
Religious Sample Employed employed
employment [pounds
group size % % %
sterling]
Males
Muslim
Pakistani 376 32 41 68
188.67
Bangladeshi 251 33 40 67
122.73
Indian 49 51 29 49
179.47
Other 55 62 18 38
175.91
Hindu
Indian 104 62 14 38
270.96
African 148 53 9 47
256.46
and Other
Sikh
Indian 161 47 26 53
185.01
African 40 45 28 55
257.69
Christian
White 428 74 11 26
304.59
Caribbean 273 58 21 42
260.86
and Other
No religion
White 304 66 19 34
287.20
Caribbean 215 50 32 50
250.88
and Other
Other religion 26 50 35 50
357.81
Total 2,430 54 25 46
244.69
Females
Muslim
Pakistani 434 8 12 92
122.73
Bangladeshi 256 4 7 96
100.48
Indian 56 15 7 86
113.29
Other 66 29 14 71
177.68
Hindu
Indian 149 36 8 64
132.23
African 137 49 8 51
170.58
and Other
Sikh
Indian 201 30 10 70
133.97
African 37 35 11 65
134.65
Christian
White 675 57 5 43
140.51
Caribbean 453 54 18 46
182.12
and Other
No religion
White 325 55 8 45
164.35
Caribbean 201 49 14 51
192.91
and Other
Other religion 39 31 21 69
196.37
Total 3,029 39 10 61
156.02
Table 3. Key results of employment probits for whites
and non-whites,
FNSEM sample (dependent variable = 1 if employed, 0 if
unemployed)
Model 1
Males Females
Hindu -- --
Indian 0.036 (0.17) -0.152 (0.63)
African Asian 0.225 (1.11) 0.055 (0.25)
Sikh -0.569 (3.49) * -0.222 (1.03)
Muslim -- --
Pakistani -0.886 (6.16) * -0.997 (4.84) *
Bangladeshi -0.184 (1.09) -0.890 (1.98) *
Other 0.073 (0.38) -0.518 (1.95)
Christian -- --
White 0.344 (2.55) * 0.274 (1.78)
Caribbean and 0.137 (1.65) 0.008 (1.65)
Other
Other religion -0.561 (1.98) * -0.616 (1.79) *
No religion -- --
Caribbean and -0.164 (1.12) 0.176 (0.96)
Other
Foreign-born -- --
non-white
British-born -- --
non-white
Non-fluency -0.224 (2.18) * 0.087 (0.57)
Sample size 1,910 1,495
Model 2
Males Females
Hindu 0.293 (1.85) 0.064 (0.37)
Indian -- --
African Asian -- --
Sikh -0.362 (2.34) * -0.254 (1.26)
Muslim -0.374 (3.07) * -0.801 (4.76) *
Pakistani -- --
Bangladeshi -- --
Other -- --
Christian 0.318 (3.17) * 0.051 (0.46)
White -- --
Caribbean and -- --
Other
Other religion -0.458 (1.65) -0.684 (1.99) *
No religion -- --
Caribbean and -- --
Other
Foreign-born 0.278 (2.36) * -0.003 (0.03)
non-white
British-born -0.379 (3.25) * -0.087 (0.69)
non-white
Non-fluency -0.261 (2.55) * -0.073 (0.47)
Sample size 1,910 1,495
Notes: t statistics are in parentheses, where t stat =
[alpha]/
SE([alpha]) and SE([alpha]) is the standard error of
[alpha].
* denotes statistically significant at the 5% level.
`Other Muslims' consists of 2% white, 4% Caribbean,
44% Indian
and 49% African for males. There are 2% white, 3%
Caribbean, 46%
Indian and 49% African females.
In Model 1 the default category is married,
non-religious whites,
who have no qualifications, are in good health, with
no children,
who are owner occupiers, who live in the South of
England
(excluding London) and have access to a car.
In Model 2 the default category is married whites,
with no religion,
born in the UK, no qualifications, in good health,
with no children,
who are owner occupiers, who live in the South of
England (excluding
London) and have access to a car.
Table 4. Decomposing differences between white and
non-white employment
probabilities into the ethnic penalty and that caused
by other
characteristics
(Model 2)
Males
Females
Total differences in predicted means 0.215 [0.237]
0.170 [0.254]
Muslim penalty 0.051 [0.055]
0.048 [0.109]
Sikh penalty 0.012 [0.015]
0.010 [0.022]
Ethnic penalty 0.110 [0.098]
0.028 [-0.051]
Differences due to other 0.042 [0.069]
0.084 [0.174]
characteristics
Note: Figures in square brackets refer to the
employed/out of
employment dichotomy.
Table 5. Key results of earnings functions for whites
and non-whites,
FNSEM sample (dependent variable log of average
earnings)
Model 1
Males Females
Hindu -- --
Indian 0.378 (0.54) 0.083 (0.61)
African Asian -0.159 (2.31) * 0.118 (1.05)
Sikh -0.216 (3.27) * 0.092 (0.83)
Muslim -- --
Pakistani -0.155 (2.32) * 0.166 (1.01)
Bangladeshi -0.289 (3.71) * 0.175 (0.71)
Other -0.177 (2.32) * 0.283 (1.49)
Christian -- --
White 0.035 (0.89) -0.082 (1.22)
Caribbean -0.063 (1.33) 0.094 (1.22)
and Other
Other religion 0.112 (1.15) 0.271 (1.18)
No religion -- --
Caribbean -0.014 (0.26) 0.124 (1.35)
and Other
Foreign-born -- --
non-white
British-born -- --
non-white
Non-fluency -0.209 (4.51) * -0.314 (3.15) *
Correlation 0.005 (0.05) -0.767 (12.21)
*
coefficient, [rho]
Sample size 1,309 1,186
Model 2
Males Females
Hindu 0.006 (0.11) 0.037 (0.41)
Indian -- --
African Asian -- --
Sikh -0.156 (2.41) * -0.053 (0.49)
Muslim -0.122 (2.23) * 0.078 (0.66)
Pakistani -- --
Bangladeshi -- --
Other -- --
Christian -0.001 (0.06) -0.078 (0.66) *
White -- --
Caribbean -- --
and Other
Other religion 0.204 (2.09) * 0.172 (0.76)
No religion -- --
Caribbean -- --
and Other
Foreign-born -0.128 (2.70) * -0.031 (0.44)
non-white
British-born 0.006 (0.12) 0.170 (2.32) *
non-white
Non-fluency -0.189 (4.04) * -0.306 (3.08) *
Correlation -0.026 (0.22) -0.754 (10.90)
*
coefficient, [rho]
Sample size 1,309 1,186
Notes: t statistics are in parentheses, where t stat =
[beta]/
SE([beta]) and SE([beta]) is the standard error of
[beta].
* denotes statistically significant at the 5% level.
`Other Muslims' consists of 2% white, 4% Caribbean,
45% Indian
and 49% African males. There are 2% white, 3%
Caribbean, 46%
Indian and 49% African females.
In Model 1 the default category is married,
non-religious whites,
who have no qualifications, work for a firm with more
than 500
employees, in the construction industry, are owner
occupiers and
live in a low unemployment area in the South of
England.
In Model 2 the default category is married whites,
with no religion,
born in the UK, no qualifications, who work for a firm
with more
than 500 employees, in the construction industry, are
owner occupiers
and live in a low unemployment area in the South of
England.
Table 6. Employment decompositions between Muslim and
non-Muslim
non-whites, FNSEM sample
Males
Females
Differences in means 0.230 [0.198]
0.295 [0.361]
[I.sup.NM] - [I.sup.M]
Differences in coefficients
[[bar]P([[alpha].sup.NM][X.sup.M]) - 0.141 [0.0921
0.165 [0.1461
[bar]P([[alpha].sup.M][X.sup.M])]
[[bar]P([[alpha].sup.NM][X.sup.NM]) - -0.035
[-0.037] 0.186 [0.176]
[bar]P([[alpha].sup.M][X.sup.NM])]
Differences in characteristics
[[bar]P([[alpha].sup.NM][X.sup.NM]) - 0.089 [0.106]
0.129 [0.215]
[bar]P([[alpha].sup.NM][X.sup.M])]
[[bar]P([[alpha].sup.M][X.sup.NM]) - 0.265 [0.2351
0.108 [0.185]
[bar]P([[alpha].sup.M][X.sup.M])]
[chi square] (18 d.o.f. critical
value)
Sample size 1286 [1695]
[859] 2018
Note: Figures in square brackets refer to the
employed/out of
employment dichotomy.
[Graphic omitted][Graphic omitted]Acknowledgements
The author is grateful for comments from two anonymous
referees and advice
from Derek Leslie, Roger Ballard and Ken Clark. The
Fourth National Survey of
Ethnic Minorities was made available through the ESRC
Data Archive.
Notes
(1) Black Africans were not included in the survey.
(2) Respondents in the FNSEM were asked two questions
concerning ethnicity.
First they were asked which ethnic group they thought
they belonged to,
followed by their family origin. This is similar to
that of other major
surveys such as the Population Census of 1991 and the
Labour Force Survey.
(3) The FNSEM also asks a question on the importance
of religion in the
respondent's life. However, this question was only
asked to 46 per cent of
non-whites.
(4) The Third National Survey of Ethnic Minorities was
conducted in 1982.
Brown (1984) provides a description.
(5) This study also excludes the self-employed. Clark
and Drinkwater (1998,
1999, 2000) explore non-white self-employment.
(6) Since the categories for the economic activity
variables provided by the
FNSEM were not mutually exclusive, the employed and
out-of-employment
variables redefined a small number of those who
answered more than once by
careful interpretation of each duplicated response.
Results presented do not
significantly differ from those derived when
duplicated answers were omitted.
(7) In these probit models, employment status is
governed by a latent index
variable measuring `employability', [E.sub.i.sup.*],
where [E.sub.i.sup.*] =
[alpha][X.sub.i] + [[epsilon].sub.i] is the latent
employment model.
[E.sub.i.sup.*] is explained by a characteristic
vector, [X.sub.i] and an
unexplained residual component, [[epsilon].sub.i]. In
practice one cannot
observe employability. One can only observe whether
the individual is employed
or not. This can be captured by a binary variable,
[E.sub.i], which takes the
value unity if the individual is employed and zero if
they are unemployed. The
observed binary outcome is related to [E.sub.i.sup.*]
in the following way.
[E.sub.i] = 1 if [E.sub.i.sup.*] > 0 and the
individual is employed or
[E.sub.i] = 0 if [E.sub.i.sup.*] [less than or equal]
0 and the individual is
unemployed. The statistical model that underlies this
is probabilistic. If the
residual term is assumed to be logistically
distributed then the probability
of the ith individual being employed is given by
P([E.sub.i]) = 1/1 + exp - ([alpha] [X.sub.i]) '
If the residual term is normally distributed then a
probit model is used.
Greene (1997) provides an excellent discussion.
(8) The FNSEM asks the interviewer to code the
respondent according to their
English language ability. The categories of these
abilities were fluent, fair,
poor or none. Here non-fluents consist of those with
fair, poor or no
language-speaking ability. See Dustmann and Fabbri
(2000), Leslie and Lindley
(2001), as well as Lindley (2001) for a discussion on
the impact of language
fluency on the employment and earnings of Britain's
non-whites.
(9) There are only 25 (8) employed Indian Muslim men
(women) with available
earnings information.
(10) There are only 18 (13) employed African Sikh men
(women) with available
earnings information.
(11) The FNSEM excludes, among others, those of a
Black African and Middle
Eastern origin. These groups form a growing part of
the Muslim population in
Britain.
(12) At the time of the survey the statutory
retirement age was 65 years for
men and 60 years for women.
(13) Full regression results are available from the
author on request.
(14) Where [E.sup.*] = X'[alpha] + [epsilon] is the
latent employment model,
the coefficients in the probit model can be thought of
as the effect of a
regressor on the latent variable [E.sup.*]. An
algebraic formulation of the
coefficients would just be [alpha] = d[E.sup.*]/dX,
whilst the marginal
effects (which are the responses of the probabilities
p(E = 1) to the
regressors) are given by dp(E = 1)/dX =
[alpha].[PI](X'[alpha]). Note that
[PI] is the standard normal density function and
employability, [E.sup.*] is
in the first expression but E (the binary outcome
variable) is in the second
expression.
(15) The coefficients in Table 3 can be interpreted as
follows. The first term
in the first column for Indian Hindu males is 0.036
(0.17). The coefficient is
0.036 and this is the effect of being Indian Hindu on
the employability of
males, relative to the default of non-religious
whites. The term in
parentheses (0.17) is the t statistic. This is a test
for the significance of
being Indian Hindu on the employability of males,
relative to non-religious
whites. Since 0.17 is less than an approximate t value
of 1.96, we can deduce
that the effect of being Indian Hindu on the
employability of males is
statistically insignificant at the 5% level.
(16) Comparing the coefficient on foreign-born
non-white of 0.278 with that on
Christian of 0.318.
(17) There are endogeneity issues involved when
including language fluency as
a determinant of earnings or employment probabilities.
Lindley (2001)
demonstrates that using single equation techniques
implies that the language
penalty may be underestimated.
(18) Here the semi-log specification of the earnings
function is used. In
practice, for low values (of around 0.10) log points
method and the level
method give the same result. The semi-log
specification is given by lnY =
[alpha] + [beta]X, where lnY is the log of earnings
and X is an ethnic binary
variable. Since X is binary, the effect of X on Y is
[Y.sub.|X = 1] - [Y.sub.|X = 0]/[Y.sub.[X = 0] =
[e.sup.[beta]] - 1,
whereas the log point difference is simply [beta].
(19) The coefficients in Table 5 are the log points
and can be interpreted as
follows. The first term in the first column for Indian
Hindu males is 0.378
(0.54). The first term indicates that Indian Hindu
males would earn on average
37.8 percentage log points more than the default
category of non-religious
whites. The second term in parentheses (0.54) is the t
statistic. This is a
test for the significance of being Indian Hindu on the
earnings of males,
relative to non-religious whites. Since 0.54 is less
than an approximate t
value of 1.96, we can deduce that there are no
significant differences between
the average earnings of Indian Hindu and non-religious
white men, at the 5%
significance level.
(20) There are endogeneity issues involved when
including language fluency as
a determinant of earnings. As a result using single
equation techniques
implies that the language penalty may well be
underestimated for males and
overestimated for females.
(21) In a single equation probit the average
predictions are virtually the
same as the sample averages.
(22) Table 3 shows an employment penalty to both
British- and foreign-born
whites, when these are compared to Christians (who are
mainly white). However,
only British-born non-whites exhibit significantly
lower earnings than
non-religious whites.