Water can also be lost through the top cuticle of the leaves, so the Privet plant has a waxy cuticle to try to prevent this occurring. Both the guard cells and the waxy cuticle are very good ways of varying transpiration. Privet’s leaves replace the water lost by means of a transpiration stream. When some water is lost and the cells become less turgid, more water is ‘pulled’ into the cell across a concentration gradient by osmosis. This chain of osmosis continues out of the leaf and into the stem and down the xylem into the root hairs, which then ‘pull’ more water, by osmosis, from the soil.
We can measure this transpiration stream by means of a potometer, which measures the uptake of water into a plant. This cannot be one hundred percent correct because not all the water taken up by the plant is lost through transpiration. Some of the water is used in photosynthesis and also the plant may also have been drained of water and plants also want to store water for later use but still a decent amount will be lost through transpiration.
A potometer is a very thin tube of glass, usually one millimetre in diameter, and thirty to forty centimetres in length. The thinness of the potometer is such that a bubble can stay in the tube without moving at all. We connect the end of the potometer to the cut end of a stem of a plant with some rubber tubing. We put a small bubble in the tube and measure the distance it moves up the tube. This distance is the amount of water that is taken up by the plant. This is therefore the amount of water given off by transpiration.
Key Factors;
There are many key factors that affect the rate of transpiration including temperature and the amount of surface area on the plant. Throughout my experiment I will have to keep these factors constant to make this experiment fair. I will keep the temperature constant by measuring it and either opening or shutting the windows or using other means of raising or lowering the temperature. The wind is the factor that I will vary throughout my experiment. I will be using a fan that I can set to many different speeds and also I could move it closer and further away from the plant.
Preliminary work;
Before a finally set up my experiment (and apparatus shown below) and recorded the results for the graph I completed some preliminary work in which I found out some glitches to look out for. Firstly I found that it was very hard to have only water in the tube and no air bubbles, because if there are any bubbles in the tube then the area of uptake for the plant is greatly decreased and therefore less water would be taken up in a specific time. Secondly the temperature was difficult to measure and change so I will try to get round having to change the temperature in the room by completing the experiments all at either the same time of day, or on the same day and then at the same time.
There are also some safety regulations about having water close to electricity and also with the thin glass tube, you have to be careful with these, as they are liable to break when you are squeezing them into the rubber tubing connected to the Privet.
Prediction;
I know that the faster the wind speed, the faster the water uptake will be. So I am hypothesising that the wind speed and the rate of water uptake will be proportional to one another. This is because when transpiration occurs it happens across a concentration gradient and if the already evaporated water lingers around the stoma then this concentration gradient will be much less. So this means that the stronger the wind then the concentration gradient around the stoma will lower with the wind strength. I will hope to receive a graph like the one above, the stronger the wind the faster the water uptake.
Apparatus;
- Potometer, (graduated capillary tube, water reservoir)
- Fan,
- Privet,
- Ruler,
- Anemometer,
- Water,
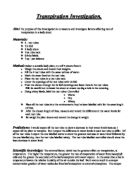
Method;
When there is lack of, or no wind then when the water evaporates out of the stoma across the concentration gradient, then this will lower the concentration gradient because there is no wind to blow this water vapour away from the stoma ready for more to evaporate. This is what I am measuring and using a fan to do so. I will be timing the experiment using a stopwatch and I will have to watch the potometer very carefully because as I will be counting how long it takes for the bubble to move in millimetres, and if I miss a count then I will have to start again.
When the bubble moves along as far as I want it to then I will use the water reservoir to push the bubble back into its original position to repeat the experiment again. I am doing this again because then I will receive more accurate results for my graphs.
For this experiment the wind speed is the independent variable so that I can measure the rate of transpiration. But it will actually measure the rate of water uptake, which is almost 99% due to transpiration. The temperature is a variable, which I will control by closing the windows and doing the experiments at the same time of day. The last variable is light, which I will keep constant by shutting the blinds and only having the light from the room lights. Lastly I will soak the plants’ stem in water before each experiment because then this will prove that the water taken up by the plant is only transpiration and not for storage in the stem and the leaves.
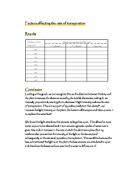
I will then place my results on a graph of water uptake against time. I am hoping that I will receive a graph like to one I drew above.