PRELIMINARY WORK
Before the experiment was designed, I carried out a certain amount of preliminary work to access the validity of my tests and to confirm the values of substances to be used. The first test was to ascertain whether concentration had any affect on the rate of reaction. I did not want to collect data that could then influence the actual experiment, so I ran two experiments alongside, with:
-
50cm3 of 20vol. H2O2 with 5g of MnO4
and
-
50cm3 of 10vol. H2O2 with 5g of MnO4
The two experiments reacted at very different rates, so concentration DOES have an effect on rate of reaction. Therefore the experiment is valid.
The second part of this preliminary work was to find the quantities of H2O2 and MnO4 that should be used to give results that would give a pleasing distribution when placed on a graph. These were noted, as I wanted a value that was most appropriate. I wanted values that gave the highest change in mass. This would make the trends easier to see on a graph. Therefore, the appropriate values were calculated. These will be detailed in the method section.
APPARATUS
The apparatus that I shall use for the reaction is:
- Top-pan balance
-
Conical Flask (100cm3 capacity)
- A measuring cylinder
-
MnO4 granules
-
20 vol. H2O2 solution
When fully set up, I believe the experiment should look like this:
METHOD
When gases are produced in a reaction, it is customary to use ‘collection over water’ methods to collect the gas. This is not always as efficient as would be desired, as huge amounts of human error can cloud the results. For this reaction I plan to measure the rate of reaction by gases produced, measuring the mass loss as an indication of the quantities released. To measure the rate of this reaction, I will take measurements of the mass released after 5 minutes, (300 seconds), allowing a graph to be plotted.
I plan to use 10cm3 of H2O2 in each conical flask. This will be added to 2g of MnO4. I also plan to use various concentrations of the H2O2, detailed below:
- I will set up the apparatus as shown above.
-
I will then measure out the correct amounts of H2O2 and H2O, to give the correct concentrations as shown in the table. This mix can then be poured in the conical flask.
-
The conical flask with solution inside can then be placed onto the top-pan balance, and the 2 grams of MnO4 can be added. The conical flask should never be removed from the balance.
-
As soon as the granules are placed into the H2O2 solution, the reaction will commence, so the stopwatch needs to be started as quickly as possible after the granules are tipped in.
- I will then wait and take measurements of the mass of the conical flask, solution and granules after the allotted time of five minutes.
-
I will then change the concentration of the H2O2, and perform the same experiment again.
- When I have a complete set of results for all concentrations, I can then REPEAT the entire experiment four times, in an attempt to remove any anomalous results.
CONTROL OF OTHER VARIABLES
- I will not alter the temperature, and I deem that any changes that occur will only be very minor. To ensure this, I will perform all experiments at room temperature.
- The amount of catalyst used will be kept the same as this can have an effect on the rate of reaction. This can be easily ensured by accurately weighing the catalyst on a balance.
- I will also always use the same form of the catalyst, granules instead of the powdered version.
- There will be no inhibitors in the experiment, unless they are in the water, I which case it is the same for all of the tests.
If all these are adhered to, then I can be sure that the experiment will be a fair one, and that all results gained will be just.
SAFETY
The hydrogen peroxide that I plan to use is only a mild irritant, but I will still wear goggles, an apron and take care then using this acid. As the reaction is quite a violent one, I will also have to take care that I have set up the apparatus correctly, as at the higher concentrations the gas can be released at a fast rate. These precautions should ensure that the experiment is carried out safely.
ANALYSIS
Taking the results collected in the experiments, I drew two graphs. The first graph plots all the figures collected for of ‘rate of gas collection’ for each concentration, against the concentration. This is done to give an idea of the spread of the data collected, and to identify any anomalous points. The second graph plots the average figures for the ‘rate of gas collection’ against the ‘concentration of the H2O2’ used. The averages were calculated by removing the anomalous pints identified in graph 1, then finding the mean. It is the second graph that I shall use to formulate my conclusions.
Using Graph 2, I can conclude that the concentration of a solution is directly proportional to the rate of reaction in which that solution is involved. This is characterised by a straight-line graph, which passes through the origin. From looking at graph 2, it is plain to see that this is the case. Using scientific knowledge, I can explain this.
By increasing the concentration of a solution, the number of particles in a given volume increases, giving more frequent collisions. These collisions cause the reaction, so an increase in collisions gives an increase in rate. This is in a proportional ratio. It stands to reason that if I double the amount of particles in the reaction (concentration), then collisions will be twice as frequent, giving twice the rate of reaction. However, it is also the case that once the amount of particles in the reaction (concentration) reaches a certain point, the rate of the reaction can no longer increase as it has reached a maximum point.
In my plan, I stated that:
I believe that as the concentration of the solution increases, the rate of the reaction will increase, in a directly proportional ratio, giving a straight-line graph through the origin on a ‘rate against concentration’ graph. However, this rate cannot continue exponentially, there must be a ‘peak rate of reaction’, where the rate cannot increase further.
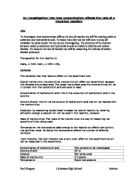
a) b)
Rate Rate
Conc. Conc.
Graph a) shows what I predicted to see on my graph, see plan, but graph b) shows what I did see on my graph. As you can see, they are both straight lines through the origins, but a) shows a noticeable plateau effect not seen on b).
This conclusion has only been partially supported by the evidence. The rate does increase proportionally in respect to the concentration, but I still cannot be sure as to whether there will be the plateau effect or not. I still believe that this is the case; as I have scientific knowledge to back my ideas up, see above. Further tests must be done to conclusively prove this. As I did not use high enough concentrations of H2O2, my experiment did not test this, so in this area it has failed.
EVALUATION
When evaluating an investigation, it is important to access the quality and reliability of the evidence gained, and therefore the reliability of conclusions drawn from these results. The number of anomalous points, those that did not fit the pattern, is always a useful indicator of the trustworthiness of the results.
In this case, I drew a graph containing all the results of all the repeats on one graph. This allowed anomalous points to be singled out. In this case, there were four points out of the total of 25, which I deemed to be inconsistent with the general pattern. This means that 16% of the results collected were anomalous. This is a very high percentage, which perhaps undermines the validity of the results collected. In conjunction with this, I drew error bars of ± 0.005 grams on my second graph. The reason for this is that the mass balance used only calculated to an accuracy of 0.01 grams, allowing 0.005 grams of inaccuracy either side of the figure given. This allowed a perfectly straight line to be drawn.
The reason for the large percentage of anomalous points to be drawn can be put down to many reasons:
-
The H2O2 used naturally deteriorates when left in the open. The purpose of the catalyst is to increase the rate of this natural decomposition. Due to the large time scale of this experiment, I did not always use the same source of H2O2. This means that if an older solution were used, the amount of gas produced would be significantly less, as it would already have reacted. This would explain the three anomalous points seen for a concentration of 50%.
- The second source for inequality in results could be the use of a granulated catalyst. On some occasions, the granules used could be in large sections, but on others in smaller fragments, more similar to powder. This means that the range of surface area of the catalyst can be huge, allowing for the anomalous points.
- The third possible source of error is the human error factor. When the catalyst is placed into the conical flask, the granules may stick to the side or the stopwatch may not be started immediately when the reaction commences. These small errors can effect the reliability of the results.
The ultimate test of the success of the investigation is to ascertain whether the prediction made in the planning section has been tested to a fully and to a suitable level, and whether the conclusions drawn after the investigation are valid with regards to the reliability of the evidence. The prediction was not fully tested. I am still unsure as to whether a plateau effect will be seen. Improvements to the experiment will be suggested later.
I believe that despite the problems encountered during the investigation, the conclusion is still valid. It is therefore sufficient to support the conclusion, although the reliability of results could greatly be improved.
There are many things that I could do to make the results from this investigation more reliable. These are:
-
I could extend the range of concentration used. In the original investigation, I used “20 volume” H2O2, which is a weak solution. If I started with a stronger H2O2 solution, such as “40 volume”, then I could investigate the plateau effect.
- I could use a mass balance with an accuracy of up to 0.001 grams. This would greatly increase the accuracy of results.
- More repeats are always desirable, I suggest doing 3 more sets.
-
I plan to use the powdered version of the MnO4, as this removes the problem encountered by the varying size of granules.
-
I could increase the volume of H2O2 used to 20cm3, and the mass of powdered MnO4 to 1 gram. This would give a larger spread of results, as more gas would be collected, and so give a truer representation of the data.
-
Due to the problems encountered with the depletion of the H2O2 over time, I shall use the same source of the solution, meaning it will all have reacted to the same level. If the H2O2 used is old, part of it will have reacted to become water (2H2O2 = 2H2O + O2), and so will have a lower concentration. Using the same source will remove this issue, resulting in a higher level of accuracy in my results.
In summary, my experiment provided successful results. The methods used were not always as reliable as would be desired, and my prediction was not tested fully due to the small range of concentrations used. Despite this, I can still say that concentration of a solution is directly proportional to the rate of reaction.