Selection:
The variable I will investigate is going to be the light distance because the distance is also in connection with the light intensity and this is what we are investigating.
Controls:
The other key variables that need to be controlled are the temperature and the size of the pondweed:
- The way in which the temperature needs to be controlled is to put a thermometer into the beaker that the pondweed is in, then record the temperature as the experiment goes on.
- The way in which the size of the pondweed needs to be controlled is that, when I start the experiment the pond weed can often be to big, which means it is giving off a lot of bubbles at once to many to count effectively, so I may need to cut the pond weed down a little, but if I do then I will need to start the experiment again to make things fair.
I will account for the variables I cannot change by stating this in my results when they are acquired.
Prediction and Hypothesis:
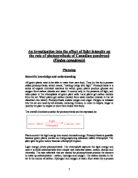
In this experiment we will be investigating whether or not the light intensity will change the rate of photosynthesis in Canadian pondweed. We will be doing this by seeing the rate at which oxygen bubbles are produced, because when photosynthesizing the Canadian pondweed produces bubbles and we can see the rate of bubbles against light intensity. The further the light away from the pondweed the less the light intensity, so the less the amount of bubbles produced, as shown in the graph below. I think if I double the distance the light is away from the pondweed. Then the rate at which the bubbles are produced will half because they are directly proportional to each other because the pondweed produces the bubbles when it is photosynthesizing it produces oxygen bubbles so the light = bubbles so the less the amount of light the less the amount of bubbles.
Observations:
We will be observing how many bubbles are produced against the light intensity then recording the results onto a table. We will be observing the bubbles by as they are formed, by counting them, then recording the number onto a table next to say when the light is 10cm away from the plant. Then moving the light back, and counting the bubbles formed over a time period of say 1 minute, and recording them against 15cm, and so on, for about 6-7 distances.
Range:
In my preliminary work, I found that the best range for my experimental variable was from 0cm to 40cm rising 5cm at a time because this would produce a suitable amount of results to produce a graph. I also found the optimum of variable of the distance the light is away from the pondweed was 0cm to give the pondweed the maximum amount of light so it can photosynthesize as much as possible and I will use this value in this experiment.
Number:
I will be taking 8 measurements so I get enough data to produce an accurate graph. I will then repeat each measurement twice to make an average and to make sure I am measuring accurately because if the two different readings are completely different then I will know I must have done something wrong. If they are completely different I will make more measurements and discard the widely different ones.
Method:
- Set up apparatus as above.
- Fill the test-tube with pond water, and then in the large beaker of cold water.
- Insert a thermometer into the beaker, and record the temperature at the beginning and end of each experiment, merely as a precaution against a significant rise in temperature, which is not expected.
- Set up a lamp at a set distance from the plant, ensuring that this distance is from the filament of the lamp to the actual pondweed, rather than the edge of the beaker.
- The light intensity was measured in the same way as described in the preliminary experiment, and assumed to be the same at any point at any particular distance.
- When bubbles are being produced at a steady rate, clear any previous bubbles from the tubing by moving the syringe.
- Start the stopwatch, and wait for 1 minute.
- Move the bubbles, which have been collected at the bend in the tubing to the part of the tube with a scale.