Therefore I predict that as the time increases the temperature will also increase by a similar ratio.
In our prelim experiment we investigated the third option on the above list, and therefore I predict that there will be a linear relationship between the time and the change in temperature. As one goes up the other goes up by a proportional amount.
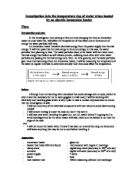
The set up for the experiment looks like this-
Obtaining Evidence-
For health and safety we had to take precautions such as being careful with all of the apparatus especially glassware in case we break it and with the electronic equipment because of the risk of electric shocks/being electrocuted as electricity and water do not mix well.
We did it in intervals of 30 seconds because our lessons last forty-five minutes and this was the most effective way of testing accurately. Any smaller and the changes would have been too insignificant, any more and they would have been maybe too dramatic to measure effectively and analyse well. We also saw, over 25 minutes, almost the entire temperature range from room temperature to almost 100%, which would be the maximum.
Our results are as follows for the actual experiment-
Analysing My Evidence
Conclusion for Experiment-
For this experiment I can conclude that as the time goes on, the water gradually heats up on a linear scale. This is because as the electronic friction in the heater grows, the particles in the water start to move around faster thus generating the heat we measured. As time goes on the water gradually becomes heated more and more.
On the graph we saw some anomalous points. We expected the graph to have anomalous points (in relation to what should be a straight line) at the beginning and end but these were due to the equipment heating up and the water (and equipment) reaching the maximum heat it could obtain from this level of power and then losing heat however there is a sudden acceleration at 11 or 12 minutes and then a huge deceleration where, on average, the water is cooler than it should be at about 13 or 14 minutes.
The anomaly looks like there is power failing to be delivered after the acceleration however it is not. We can explain this anomaly by saying how we didn’t stir the water until about the tenth minute and so this had a net effect and the water suddenly heated up rapidly, but then didn’t heat up very much for a good few seconds once the heat had spread out evenly. This is a non-uniformity in our results that gave us anomalous results.
There could also be certain amounts of energy being put into sound energy, e.g. when the water steams (if it does at all) it would give off a faint hissing sound. It would also go to the polystyrene cup as that has a very low heat capacity unlike plastic or glass, our other possible options.
There is also an anomaly, which we suspect was a mis-reading of the thermometer as it is barely one or a half of a degree out of what it should be and there is no way this could be due to the apparatus malfunctioning because it is too insignificant.
Other than those points, the graph looked exactly how we suspected because of our accounting for the apparatus getting up to temperature and losing heat at the end.
These results entirely agree with my prediction as it doesn’t take a genius to see what is going to happen however I didn’t suspect the stirring of the water to have such a great effect and neither did I fully anticipate the heating up of apparatus at the beginning and losing of heat at the end.
We assumed that barely any water was evaporating as this would only be an acceleration to the heating process and we know the water lost heat.
Evaluating My Evidence
Evaluating Evidence
My evidence was highly reliable due to the fact we set the experiment up very well and the results were consistent. All this is evidence that our experiment was successful and reliable in giving accurate results.
The anomalous results are explained above however I will summarise briefly what is stated. Firstly, there is a point at the middle where it appears to have drastically heated up and cooled down again however we discovered this was because we didn’t stir the water properly and when we did there was suddenly a uniformity across the water where the heat had spread out, but as it had done this the overall heating process was shortened slightly as it took the water a few seconds in order to get back to the normal heating state it should have been at had we stirred from the beginning. Although on the graph it appears the results continuously go up, if we draw on a line of best fit we can see that directly after the acceleration (due to us stirring) the first point is substantially hotter than average, or should have been had we stirred from the beginning, and the last point is significantly cooler than it should have been.
There were also anomalous results at the very beginning and end where the equipment was either heating up or losing heat.
Despite these anomalies I can safely say that my graph and my results likewise strongly support my prediction in the planning stage of this essay and it also supports a firm conclusion.
Propositions for Future Experiments
In any further experiments I would suggest several improvements from the conduct of the pupils through to the accuracy of the equipment.
Firstly the measurements that could be taken differently-
We could have used a more accurate power supply (despite the ammeter and voltmeter being very accurate, having a human judge is not always the best option) and a more accurate thermometer, e.g. a Thermo couple.
Secondly the water we used was not pure, it was straight out of the Whitgift plumbing system which suggest it was seriously impure, and if the water had been hard-water it would have effected the heating rate significantly as hard water contains calcium carbonate from limestone, which doesn’t heat easily thus preventing the water from heating as fast as other water. As an improvement, I suggest that we use either distilled water or pure bottles water. Different types f water have different heat capacities that can vary significantly for the sakes of our experiment.
We also lost some power due to the length of the wires. If there are shorter wires we would save a lot of energy we would otherwise lose due to energy going elsewhere.
Something I also mentioned in the planning stage was the material the beaker was made out of and the outer beaker shown in the diagram. There are a number of suggestions for improvements here. Firstly, we used a polystyrene cup inside a glass beaker. I’m not entirely clear on whether this was to prevent further heat loss or to stabilize the thermometer as the cup would have fallen over under its weight but both are good reasons for it to be kept in the experiment. It also might be to
The material of the cup is also very important as different materials have different heat capacities and although polystyrene is a good insulator, it also melts easily so it might not prove the best material to use. A good replacement might be plastic, porcelain or wood. We could also use glass in order to take readings more easily. This would be if we were measuring something else e.g. the mass of the water.
For further work we could also investigate the other two experiments that we didn’t for the purposes of this essay. However within our own experiment we could investigate better insulation and power sources, i.e. what effects power has and how increases power affects the results.
AN INVESTIGATION INTO THE FACTORS AFFECTING THE TEMPERATURE RISE IN WATER HEATED ELECTRICALLY by Jonny Cripps