The reaction between Sodium Thiosulphate was chosen as the sulphur (as shown in the chemical and word equation on the previous page and above) would appear in the solution. This would allow us to place a piece of paper under the conical flask with a cross on it and look over the solution to see when the cross disappears. A stop clock would be used to time the amount of seconds it would take for the cross to disappear. The same piece of paper will be used for all the repeats, so that more accurate results are collected.
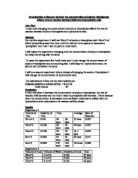
To ensure safety goggles are collected and worn as we are using Hydrochloric acid used which is corrosive. The apparatus will be collected and set up. The first dilution will be made with 10cm3 of Sodium Thiosulphate and 40cm3 of water (5cm3 of Hydrochloric acid added later). The closest sized measuring cylinder will be used to ensure accuracy. A 10cm3 measuring cylinder will be used to measure the 10cm3 of Sodium Thiosulphate, a 50cm3 cylinder for the 40cm3 of water and a 10cm3 for the 5cm3 of Hydrochloric acid. The 10cm3 cylinder is always used for the Hydrochloric acid as the concentration is not changed throughout the experiment because the Sodium Thiosulphate is the only one changed for fair testing. The flask is placed over the sheet of paper with the cross on it. The Sodium Thiosulphate and water will be put into the conical flask and the stop clock will be reset ready to begin. One person will put the Hydrochloric acid in as the other starts the stop clock. Then the solution will be watched from the top of the flask and the stop clock ready to be stopped. Once the cross is no longer visible the stop clock will be stopped and the time will be recorded. The conical flask will be cleaned out and dried for the next concentration. The concentrations used are as follows:
The concentration of 0cm3 Sodium Thiosulphate and 50cm3 of water will not be done as there would be no reaction. The reactions will be repeated 4 times to be able to get an average and the same piece of paper with the cross on will be used in each reaction to ensure reliability.
Fair Testing:
To keep the investigation fair I will only change the concentration of the Sodium Thiosulphate. I will not change the concentration of the Hydrochloric acid and use the same equipment for all the results. To make my results as accurate as possible I will use the closest measuring cylinders to the measurments shown in the table in the plan.
Prediction:
I predict that as the concentration of the Sodium Thiosulphate increases the rate will also increase. The fastest will be 50cm3 Sodium Thiosulphate with 0cm3 water because the more concentrated the Sodium Thiosulphate is the more collisions there will be, which will increase the amount of reactions and the rate. The slowest will be 40cm3 and 10cm3 Sodium Thiosulphate because there will be less Sodium Thiosulphate molecules in the same space, which means there will be less collisions with the reactant (hydrochloric acid).
Apparatus:
Sodium Thiosulphate solution, Hydrochloric acid, water, conical flask, paper, pen, stop clock, 50cm3 and 2x 10cm3 measuring cylinder.
Method:
The apparatus was collected and set up ready for the experiment. Goggles were collected for protection as we were using dangerous chemicals and the windows were open as harmful chemicals were produced. The first solution was made with 10cm3 Sodium Thiosulphate and 40cm3 water. The 10cm3 measuring cylinder is used for the 10cm3 of Sodium Thiosulphate and the 50cm3 cylinder for the 40cm3 water. The 10cm3 measuring cylinder was used with the 5cm3 of Hydrochloric acid throughout the experiment because it was not changed. The Sodium Thiosulphate and water were firstly put into the conical flask, which was placed over the paper with the cross on it. Then the Hydrochloric acid was added and the timer started. Once the cross on the paper was no longer visible the timer was stopped and the results recorded. This was repeated for all the concentrations. Once the reaction was over the waste was poured down a sink with the tap running. The same piece of paper was used for all the concentrations and the experiment was repeated 4 times for each concentration.
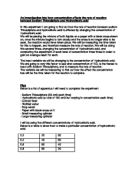
Results:
*results that were repeated as they were anomalous and were not used in the average.
Conclusion:
I found that if you increase the concentration of Sodium Thiosulphate the rate also increases. My prediction was correct as the results and graph show that the higher the concentration of Sodium Thiosulphate the faster the rate. It is proven that concentration, if high, increases the rate, which is shown in the table of results. When 10cm3 of Sodium Thiosulphate was mixed with the 40cm3 water this decreased the concentration of the Sodium Thiosulphate. The graph shows at this point that the rate was very slow as it took 154 seconds to finish reacting. When 50cm3 Sodium Thiosulphate was in 0cm3 water it was not diluted and so was the highest concentration of all. This affected the rate of the reaction a lot as the graph shows that it took very little time to finish reacting and the time was 30 seconds. This shows that a high concentration gives a fast rate of reaction and a low concentration gives a slow rate of reaction.
Evaluation:
I think that overall the method used was reliable, accurate and safe. I think that the results are fairly reliable because most of them are close together. Some of the results were anomalous, but this was because the solutions of Sodium Thiosulphate and Hydrochloric acid were not the same. I would have liked to have used more accurate equipment to make up the solutions or have made the concentrations with special, reliable and more accurate equipment to improve my results (e.g. Grade A glassware). I was unable to have the expensive and reliable equipment. Using the paper with a cross on to be able to collect results was a relatively reliable way used. The results were averaged to be more accurate, but there were some results that were anomalous (e.g. set 1 time = 115, set 3 time = 173). This was because different solutions of Sodium Thiosulphate and Hydrochloric acid were used during the experiment. The temperature of the room could not be controlled, which could have also affected the results. To get a more accurate and reliable graph I could of got more than 4 sets of results and done more concentrations.