pH of the potato = 6.4
Also, these are the results from another experiment, which was set up the same as the first one but was timed until 20ml of water was displaced.
From these results, the optimum pH and the graph of how the catalytic rate changes over ph regions. From the tabulated results it appears that the optimum pH is at around 6-7, which will be determined more accurately via the graph. This is unexpected because it would have been expected that the pH was to be more neutral, but according to the readings the pH of the potato was 6.4. This is even more unexpected. The potato grows in a soil solution, which would have a pH of approximately neutral, and not this far out. Given the pH scale is logarithmic, these results are giving evidence to suggest that the percentage of Hydrogen ions is nearly a quarter of that of the neutral solution
Roughly: 10^7 = 10000000 and 10^6.4 = 2511886
So 10^7 / 10^6.4 = 3.98.
Further, the catalase although may be first in a different pH to that of the neutral solution of pH 7, it is producing water and oxygen, the production of these would cause the solution that the catalase is in to become more neutral due to the increasing presence of water. This could be an example of negative feedback, where as the catalase breaks down more hydrogen peroxide forming the water and oxygen, the pH of 7 then starts to slow the rate of catalase. This is unlikely, however, because the hydrogen peroxide is a toxic, and the catalase will not have evolved to form solutions that slow its activity down.
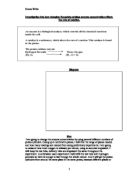
Conclusion
The first graph demonstrates how the catalase has an optimum pH for it to have its highest turnover. The graph also shows breakdown points in the alkaline regions. It is shown that a pH of 9 takes much longer to break down the peroxide than the pH of 8, where it is approximately 7 times as long, shown by (201 (mean of pH:9) / 30 = 6.7).
This point can considered a break down point for the catalase as it becomes denatured to the degree where it cannot perform to a noticeable effect, discussed later. This also can be seen on the acid side of the pH range. The graph has been continued to demonstrate this.
The appearance of the graphs of the 2 different experiments is similar. This is expected because of the varying values of the pH that should be seen to have the same effect on the catalase between the 10ml and the 20ml experiments. This is represented in the graph because it forms a similar ‘dip and curve’, seen in the 10ml experiment.
- The dip is where the optimum pH range is for the catalase.
- The curve is where the pH range is outside the optimum range and curving towards a longer time
- The breakdown point is where the catalase appears to have been denatured by the pH and is reacting so slowly or not at all that the time taken is taken as indefinite. (“oo”).
From these conclusions, the enzyme is shown to have different rates of reaction at different pH ranges. In acidic solutions of less than 5, the reaction rate appears to decrease very quickly over a short range, quickly tending towards a zero reaction rate. The same applies to pH’s over 8, as the graph shows that the reaction rate decreased quickly also. There is one region where the time is relatively quick, between pH’s 6 and 7, with the quickest reaction time at approximately pH 6.5-6.6.
The causes for these changes will be due to changes in the tertiary structure of the catalase enzyme. Proteins contain amino groups that contain nitrogen and two hydrogen atoms. The nitrogen is electronegative, which means it pulls the electrons of the atoms in its covalent bond forming a –ve charge, and respectively a +ve charge on the hydrogen atoms. An example for a way for the pH to affect the structure of the catalase is with the aqueous hydrogen ions (H+) or the hydroxyl ions (OH-) being attracted to the charges on the atoms in the proteins, such as the amino acid group, or the carboxyl group which is situated after the amino group-carbon bond. When these atoms approach these charges, the charged protein atoms could be attracted to the hydrogen or hydroxyl atoms and break away from the protein. This break up of the charge will affect the 3 dimensional structure of the protein, changing the shape of its active site. According to the lock and key hypothesis. This theory states that the active site for a biological catalyst is specific to the substrate it is working on. Therefore a change in the shape of the active site will affect the enzymes catalytic rate because the active site will increasingly change from its original shape due to the effect of the pH solution
It is unable to bind with the substrate forming the enzyme-substrate complex as readily, or even at all.
It is not necessarily the charges on the atoms that the hydroxyl and hydrogen ions are attracted too. They may approach the hydrogen bonds in the tertiary structure of the protein. The hydrogen and the oxygen are attracted to each other forming the hydrogen bond not due to a covalent bond between them, but because they form electronegative elements. Oxygen, like nitrogen, is electronegative and forms a sigma minus charge on it. This is attracted to the sigma plus bond on the hydrogen. The presence or the H+ or OH- can break these bonds, which subsequently breaks up the tertiary structure of the protein and consequently the protein’s active site.
This can explain the trend shown by catalase that it denatures in high alkaline or acidic solutions. Also, the optimum pH of the enzyme is where the concentration of the hydrogen ions or the hydroxyl ions is best suited to the enzyme. In the case of catalase it was around 6.5. This is just where the active site is not affected by changes in the tertiary structure due to denaturing by the pH.
The agreement between the pH of the potato and the optimum pH of the catalase is quite close. The pH of the potato was recorded of the potato was recorded as 6.4, and the optimum pH of the catalase was approximately 6.5. These values should be expected to be close because the pH of the potato is the solvent that the catalase is working in. It would not be beneficial if the potato were outside the optimum pH of the catalase, as the catalase would not be able to have as high a turnover of hydrogen peroxide, which is a toxin.
Evaluation
The experiment, ignoring errors entered outside the method, appears to be relatively successful, given the close approximation between the pH of the potato and the optimum pH of the enzyme, and also the clear trend of the breakdown of the catalase in high concentrations of hydroxyl and hydrogen ions, reflected in the pH of the solution.
During the experiment there was a problem with the pH meters. This is being mentioned because it may have affected the results, although the method was accurate in principal. Due to the erratic effect of the pH meters, and the relatively inaccuracy of the (quantitative) analysis of the universal indicator paper, the optimum pH and breakdown points are unlikely to be exact. However the shape of the curve will be very similar. It is similar in appearance to the activity of other enzymes, and also temperature instead of pH, which would have a similar effect through a different way.
The experiment could be improved using different concentration of the sodium hydroxide and the hydrochloric acid. The experiment was carried out using an addition of the acid or hydroxide to the 5ml of the Hydrogen peroxide. As this changed the volume of the overall solution, it also changed the concentration of the hydrogen peroxide. This reduces the chance of the catalase molecules reaching the hydrogen peroxide molecules, reducing the reaction rate. However, as it is only the pH that affects the stability of the catalase structure, and not the concentration, the effect of this is reduced. In the graph the effect that this would have if this did not effect it would be to reduce the time slightly for the reactions as it further away from the control solution, which was the pH of the hydrogen peroxide, which was found to be approximately 7.2. (Note: This may be inaccurate as it was tested later when the pH meters became more random).
The experiment could also be improved using a water bath kept at a constant temperature. It is known that the temperature affects the rate of the enzyme catalytic rate so for more accuracy then the temperature of the water should be kept at a constant. During the experiments there may be changes in the environmental temperature, which affect the temperature slightly. Aside from these two tweaks, the method seems accurate.
The limitations of the apparatus used normally would be small. There is not much room for error in the use of the apparatus, except for where the bubbles are collected. The tube needs to be completely sealed so non of the escaping gas can escape and the delivery tube end must be placed directly in the upturned test tube else oxygen may escape. From the collected the results, the shape of the graph will not likely change, except may be shifted to one side as the pH meters may have been reading a lower or higher pH than the real one. Or it may be stretched as the pH meters have an accuracy rating of approximately + 0.01 pH units. This means that the points may be moved to one side or the other. The accuracy of the time is quite accurate, as it was + .1 of a second, which is for example 25 seconds is a very small percentage.
The assessment on the conclusions made appears to be accurate given the similarity between the potato pH and the optimum pH. If the accuracy of the pH meters is + 0.1 then the readings can be considered the same given the error range.