From this graph I can construct a hypothesis.
HYPOTHESIS:
The further you go down the alcohol series (i.e. starting with methanol, followed by ethanol etc.) the more heat is given off during combustion, with both weight and mass as constant. This means that of the four alcohols we investigate, pentanol would be the most efficient as a fuel.
The following is the method for a trial run experiment we will undertake in order to familiarise ourselves with the process of this experiment, and so we can find any problems we need to improve upon for the final experiment.
APPARATUS:
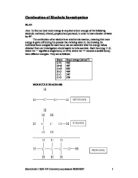
Alcohol burner – to contain the alcohol and to expose it at a steady rate to the air via a wick.
Clamp and clamp stand – to hold the beaker of water in place, suspended above the alcohol burner.
Thermometer – to measure the temperature of the water so we know when to put out the flame of the alcohol burner.
Copper vessel - to contain the water
Weighing scales – to measure the mass of the alcohol burner before and after burning enough to provide the desired temperature change on the water.
METHOD FOR TRIAL RUN:
The apparatus was set up as above. We filled the copper vessel with 100cm3 of water. The reason we chose water is because it is easily obtainable and also we know the specific heat capacity of it to be 4.2, which is part of a formula we need to use once we have obtained the results.
We chose 100cm3 because it is a convenient number to work with. We kept this constant because it was not a factor we were investigating and to ensure a fair test we needed all the values the same.
We weighed the alcohol burner and its contents before and after burning. The presence of the container during weighing was not important as it cancels itself out when we subtract the before and after values. We decided that we would heat the water each time from 20°C to 60°C because soon after it reaches sixty, some of the water will start to evaporate, lessening the mass inside the beaker and therefore compromising the constant. Again we needed to keep this temperature change constant throughout the entire experiment, to ensure a fair test and because we were not investigating this factor.
We placed the thermometer into the beaker, so as it didn’t touch the bottom of it, which would cause the reading to be changed by the copper’s heat. For every different alcohol, we used a different alcohol burner, so the contents could not mix at any point.
The difference between the results we obtained from this trial run and the previously agreed calculations were large. Different readings from the same alcohol would vary erratically, and we decided that this was due to heat loss to the air and only partial contact of the wick with the beaker at times.
The reason for this was that the flame was easily blown and changed direction from movements such as people walking past etc. This meant that the flame wasn’t in contact with the beaker at all times, so some of the heat was being conducted to the air rather than the water. This meant it would go undetected and would cause more alcohol to be needed to heat the water than otherwise.
The bottom of the beaker would acquire a layer of soot and dirt per use, and this was hindering the heat transfer slightly. This would need to be cleaned after every use to ensure more accurate results.
FINAL EXPERIMENT IMPROVED METHOD:
The apparatus was set up in the same way as the trial run, except this time, surrounding the beaker were two heat mats to act as draft excluders. This would virtually eradicate the draughts that hindered the trial run. The following diagram shows the new set-up:
As before 100cm3 of water was put in the beaker. This time, the bottom of the beaker was cleaned for soot before each reading was taken. The thermometer was placed in the same way as before, we again lit the burner until the water had changed temperature from 20 to 60 degrees C. Again, the burner was weighed before and after heating the water, but this time the lid was kept on to make sure no alcohol evaporated on the way to the scales, which would compromise the integrity of the readings. Where each alcohol had two readings taken from it in the trial run, this time we would take three readings from each to give a better average.
RESULTS:
From this table of results we can take the averages, to give a more accurate final set of values.
AVERAGES
ANALYSIS:
Heat energy = mass of water x temperature change x specific heat capacity
∆H = 100 x 40 x 4.18
= 16720J
METHANOL: Heat per gram of methanol = 16720
2.27
= 7365Jg-1
=7.365kJ-1
Heat output per mole of methanol = 7.365 x 32 kJmol-1
= 236
Enthalpy = -236kJmol-1
ETHANOL: Heat per gram of ethanol = 16720
1.8
=9289Jg-1
=9.289kJg-1
Heat output per mole of ethanol = 9.289 x 46 kJmol-1
= 427
Enthalpy = -427kJmol-1
PROPANOL: Heat per gram of propanol = 16720
1.4
=11943Jg-1
=11.943kJg-1
Heat output per mole of ethanol = 11.943 x 60 kJmol-1
=717
Enthalpy = -717kJmol-1
PENTANOL: Heat per gram of pentanol = 16720
0.97
= 17237Jg-1
=17.237kJg-1
Heat output per mole of ethanol = 17.237 x 88 kJmol-1
= 1517
Enthalpy = -1517kJmol-1
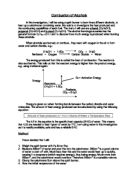
From these results we can plot a graph of the enthalpies against the number of carbons in each alcohol, as in the graph of predicted results on page 3.
From the above graph we can see that the results gained from the experiment are similar in their form. They both are negative lines, showing that more energy is given off the bigger the alcohol molecule is. However, striking differences between the values for predicted and experimented will become apparent with a graph comparing the two, as shown below
CONCLUSION: The graph comparing the predicted and measured results shows a large difference in scale. The predicted results line is much steeper than the one for the results that were obtained during the experiment. This means not that the alcohols did not burn as well as they should have, merely that the energy transfer to the water was by no means 100% effective. The explanation for this is that no matter what measures were undertaken, it would be impossible to minimise the factor of heat loss to the air in a reasonable school laboratory environment. A large amount of the energy given off by the combustion was either given to the air or retained in the metal of the apparatus. We can assume however that if all the alcohols were subjected to the same amount of heat loss, they would still be proportionally correct. Therefore we can compare the shapes of the two lines rather than the scales.
As shown in the comparatory graph the shapes of the two lines are in essence the same. They are both negative correlations, regardless of steepness, so despite the inaccuracy, the experimental results have still shown to agree with those predicted in the planning of the experiment. This renders the hypothesis correct, as does the fact that as noticed, pentanol is indeed the most effective fuel of all the alcohols we investigated. The most energetic bond is the bond between oxygen and carbon, so the alcohol with the most carbon would logically have the biggest enthalpy.
From the graph we could also predict the enthalpy of butanol. This was not investigated in the first place, but as it falls between propanol and pentanol, we could find its enthalpy by finding the average between the predicted enthalpies of the aforementioned.
-1732.5 -2875.5 = -4608
-4608 / 2 = 2304
Therefore enthalpy of butanol should be 2304kJmol and this is reflected in the reading on the graph on page 3.
While the results obtained proved to be inaccurate in scale, the experiment was largely a success. However an experiment of this nature was relatively easy to prove right. However it would be a much harder task to do so with a high accuracy.
EVALUATION:
Inaccuracies in the results were largely not down to the direct fault of the people undertaking the experiments, merely factors which could not be controlled in such an environment as was present. There were a few constraints, either by the nature of the experiment or the conditions the experiment was done under.
CONSTRAINTS:
Time was a limiting factor in the experiment. If more time has been allowed for the experiment, more readings could have been taken, giving a more accurate average result at the end. However in this case the results were doomed to inaccuracy anyway so it shouldn’t have mattered. Also, while time would not have a direct link to the quality of the results, there is always the likelihood that time pressure could cause the experiment to have been rushed, which could cause inaccuracies or anomalies Thankfully time pressure was small in this experiment so again this shouldn’t have been to much of a concern.
The wick size varied drastically between different alcohol burners. Some were prominent and frayed, allowing a large amount of alcohol to evaporate and burn at any one time. Others merely poked meekly out of the top of the burner, allowing little alcohol to evaporate and therefore create only a small flame. This might have not reached the bottom of the copper container so well and this may have accounted for such large heat losses to the air as there were in the experiment. As there is less contact with flame to metal, there must be more contact with the air instead, allowing more heat energy to be radiated into the air.
The environment and conditions were a constraint in themselves. As stated previously, it would be unfeasible to create such measures within a school environment to effectively minimise heat loss to the air.
IMPROVEMENTS:
To increase accuracy, more measurements could have been taken per alcohol, even though three, as was undertaken, could easily be accepted as sufficient. The more readings taken, the bigger the chance of spotting any anomalies, even though there were no glaring ones in this particular investigation.
No matter how much the bottom of the vessel was cleaned, there would still be some dirt on the bottom which could hinder the energy transfer, so an easier to clean vessel could be utilised.
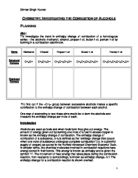
The only way to maximise energy transfer to the water and eradicate heat loss to the air, would be to use a bomb calorimeter, as shown below. However this is highly unfeasible for such a small-scale experiment and contains too much water, so heating it all by 40 degrees would take a lot longer, almost certainly not enough to be completed in the time given.
the bomb calorimeter is a thermally sealed environment, meaning that there is no way for heat energy to go anywhere except the surrounding water.
EXTENSION TO EXPERIMENT: As an extension to the experiment, we could investigate more alcohols, even though the outcome is a forgone conclusion. Also, we could use other substances than water. They would give different results altogether, as their specific heat capacity is different.
Acknowledgement:
Figure 1 from www.innovescent.com
Steve Smith 11SB 11P Chemistry coursework 08/05/2007