Internal Factors
There are a number of anatomical and morphological differences between plants/leaves, which influence transpiration rate i.e.
- Leaf Area – A proportion of the water loss via cuticle thus increase in area leads to increase in transpiration irrelevant to concentration of stomata (which will also increase as leaf area increases.
- Cuticle – This is a waxy covering outer leaf surface, which eliminates water loss. The thinner this is, the increased rate of transpiration.
- Stomata – The greater the number of Stomata per area, the greater the rate of transpiration.
The internal factors which affect transpiration will be minimised by the use of the same leafy plant throughout the experiment, and allowing five minutes for the plant to equilibrate before introducing the air bubble.
External factors will be minimised using the following precautions.
- Humidity- this I assume will be constant in the lab and will not drastically alter, in the time frame of the experiment.
- Temperature – will be constant in the room, but will vary as the intensity is increased, due to an inherent flaw in the way light is to be delivered. The overall temperature in the room will be controlled centrally via air-conditioning.
- Air movement – I will stay away from open windows.
- Water availability – The water reservoir can be constantly replenished by the reservoir in the potometer, which will be used to reset the air bubble to zero.
Predictions
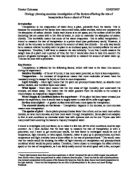
Predicted graph, this straight line indicates that as light intensity increases so does then the distance moved in a particular fixed time increases
Light intensity
In (Lux)
Time in (secs)
The rate of transpiration will be calculated by Rate = Distance traveled (mm)
Time (seconds)
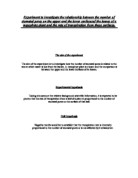
This will result in the following graph
Rate of
Transpiration
Light intensity (Lux)
Within this planning section the accuracy and validity of the data has been discussed, and will now be further highlighted by the way in which the experiment is to be carried out, the method.
Apparatus
- Potometer and meter rule
- One leafy plant with a suitable size shoot
- Beaker of water to fill the reservoir of the potometer
- Clamp stands (to support the plant)
- Lux meter (measure the light intensity)
- Lamp (source of light)
- Stop clock
- Vaseline (to ensure an airtight seal between the shoot and the potometer)
- Cutters
- Wire (to wrap around the rubber bung where the shoot enters the potometer)
Method
Settings
- I shall cut the plant under water about 2cm above the stem. This is so the blockage is removed from the xylem from where the plant was last cut. I must also cut the stem at an angle to make sure that the xylem vessels do not get crushed. This shall be done under water to prevent air bubbles getting into the xylem affecting the validity of my results.
- I shall submerge the whole potometer end into the water and squeeze tubes to get rid of any air in them.
- I will then put the stem of the plant into the rubber tube whilst it is under water.
- I will open the clamp, lift the funnel upright above the capillary tubing, them I shall poor water into the reservoir, thus ensuring an air tight seal, them support the reservoir with a clamp.
- I will them fit the stem of the cut shoot into the tubing under water, whilst doing so I will wrap a piece of wire around the stem and the tubing tightly, still under water to produce a seal.
- The potometer will then be lifted out as well as the shoot; smearing some Vaseline around it will seal the stem/shoot joint.
- The apparatus will then be left to stand for five minutes to allow the plant to equilibrate before the introduction of an air bubble.
Safety
- I am using a sharp cutter and I must take care when using it for other people as well as myself and I should not leave them lying around.
- I will also take care not to spill any water on the floor because people may get injures when slipping, to prevent this I must clean the with a paper towel the excess water spilt on the floor
- The apparatus must be secured with a clamp stand and kept off the edge of the table so it will not fall off if people brush past it.
Measurements
- I shall be taking measurements using a meter rule; any measurements will be recorded in centimetres.
- I shall begin firstly with the bubble at the start position and measure the distance travelled and then move the bubble back to its original position, to ensure each measurement will be taken from the same point.
- The measurements will be calculated to two decimal places.
Precautions
- I have repeated each experiment three times to be able to obtain a valid average from the set values. I also repeated it three times to make it easier for me to be aware of any analogous results. I used a light metre to measure the amount of lux that my lamp provided at different distances from the plant. I also considered the lux without shining the lamp.
Obtaining valid resultants
I measured the temperature in the room at the beginning of the experiment, which was ___. I also took great care in not leaving any windows open. However if a window had been left open I would leave it open during the experiment to make it fair so the humidity of the air would change due to the different weather conditions.
I outlined in further detail about the precautions in my plan and tried to limit the effect of external factors.
Results and Analysis
With the restrictions of the apparatus it was only possible to get a maximum light intensity of 1340 lux. The table below shows the distance of the lamp from the plant.
I tabulated my data so that it would be easier to view and also to be analysed. See table below. With the time constraints and the repeated attempts ie 3 for each light intensity, I was only able to time for 3 minutes.
Now according to my hypothesis, which was mentioned in the planning stages of this project, as light intensity increases the transpiration, would also increase, as more stomata would be opened. Thus if we take the distance the bubble travels at 30 seconds, 90 seconds and 120 seconds and plot the variables against increasing levels of light intensity we should see an increase in distance travelled, resulting in an upward sloping line on a graph.
However if we have a look at the table of results we note that there is not an increasing trend as would be expected. See table and graph below:
The graph shows that although the water uptake did increase with increasing time, the distance travelled did not notably increase with increasing light intensity. This can be seen as the lines on the graph were more or less flat or even decrease with increasing intensity.
There are a few reasons why this may be the case:
- There was a fundamental flaw in the way in which the experiment was carried out, or the equipment that was used.
- The light intensities used did not give an accurate representation of the spectrum needed to adjust the transpiration rate significantly, and the variations in uptake are contributed to an adjustment in the external factors, which influence transpiration.
As far as I could assess I had taken all possible precautions to ensure that the results were valid. With regards to the range of light intensity not being accurate to adjust the rate of transpiration, this can be assessed if we analyse data, which incorporates a wider range of light intensities.
Analysis of given data
From the set of results that I received, see appendix______, given to the class, it I possible to asses if an increase in the light intensity results in an increase in the distance the bubble moves, ie transpiration.
This graph showed that the average distance that travelled by water reached a maximum, but then it also has a down turn at 3950 Lux intensity. This did not make sense as I expected the average distance to remain at a constant maximum, as all the stomata are open. So then I plotted the same graph using the average results from the distance at 5 minutes and at 10 minutes. They also repeated the pattern of a down turn after 3450-lux intensity. This will be further discussed in the conclusion.
Now that we know that the data seems to follow an obvious predicted trend, I have extrapolated the following six graphs. They represent the total results that were available for analysis including an average, which was also plotted. The reason for doing this was to establish if the rate of transpiration was constant for each of the intensities (ie was the graph a straight line) or if it fluctuated due to a change in circumstances, or environment, thus checking the validity of the results. The graphs show that the rates are constant and that any rate calculated for a graph would be accurate for that lux, irrespective of where the gradient was taken, as it was constant throughout.
Using the results that received it is now possible using average values, to calculate the rate of transpiration at differing light intensities.
This graph clearly shows that there is a maximum rate of transpiration, which is dependant on the light intensity. It also clearly shows that as light intensity increases the rate of transpiration also increases, up to a maximum. This can be explained if the stomata and its mechanisms are explored.
Evaluation
During the experiment timeframe I had to repeat the experiment, because at the first attempt was a total failure. I assumed that the reason for this was that he wire which I had tied around the rubber tubing which held the shoot was loose thus an air tight seal had not been created.
I also suspected that the equipment was flawed, for example the potometer that I used to measure the distance with did not give the readings that I expected. As far as I could evaluate at the time all external factors had been taken into consideration, but the results were not varying enough, and I did not have the means to increase the light intensity as I would have wished. Some of the external factors which I had less control than I anticipated were a/c which although maintained a constant temperature also maintained and altered the air flow within the room.
Also it was not until completing the experiment that I noticed that there was a tear in the rubber tubing of the potometer
The reason why the results that I obtained did not seen to follow the trend is two fold, besides the reasons mentioned above. Both due to errors in the data collection and the two variables, being not as variable, (I am referring to the light intensity and to the time that the distance travelled was measured.)
The range of the light intensity that was available to me did not allow a sufficient enough change in transpiration which would be accurately represented in the three minutes that I took as a measure of maximum time, taking into consideration the flaws of my particular measuring device. In other words I believe that the instruments that I was using were not sensitive enough to detect the change in transpiration, either because the rate did not significantly increase at that intensity or because the instruments were not maintained.
The results given to me did show that at increasing light intensities there is an increase in transpiration. However there was one anomaly that I did not expect, that was that at 3950 lux there was an apparent reduction in the rate of transpiration, this can be because there was an error in the experiment at this level or because >>>>>>>>>>, either way it would be nice to see if this trend can be repeated.
If I was to do the experiment again then there would be some added precautions I would take to try to obtain more accurate data. These included using instruments that are well maintained, checking thoroughly the instruments, having a higher wattage bulb allowing a greater range of light intensities, to increase the time that the uptake of water was measured for ie for about 10 minutes, as was done in the results that were given to me.