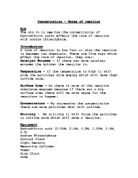
The rate of the reaction = 1 1
Time s
Rate of reaction =concentration dm3
Time s
Rate of reaction= Mass g
Time s
Apparatus
Burettes x2- burettes are the most accurate measuring equipment we can use at school.
Measuring cylinder 10 cm3- for acid.
Stop clock
Goggles
Heat proof mat
White paper with black cross
2m HCl
0.1m Na2S2O3
distilled water
stand
clamp
measuring flask- for unwanted drips from burettes.
Measuring flask- For holding acid for whole experiment.
Pipette- for acid we use it because of its high level of accuracy.
I will be measuring how long it takes for the cross to no longer be visible when the conical flask is on it with the solution inside it.
Control variables: I will keep the concentration of the HCl the same (2 mol dm3)and the same volume (5cm3). I will keep the temperature the same. I will keep the equipment and the volume of liquids the same and there will be the same person each time judging when the cross disappears each time. To make sure that I use the same liquid each time I am going to pour some HCL into a measuring cylinder so as it does not get contaminated and so I do not end up using a different acid the next time I do the experiment. I will be measuring the rate at each concentration twice so as can take an average and be more accurate in our results. I will be taking the following results twice-
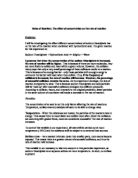
The word equation for this experiment is;
Sodium thiosulphate + hydrochloric acid Sodium chloride + water + sulphur dioxide + Sulphur
Na2S2O3(aq) + HCL(aq) NaCl(aq) + H2O(l) + SO2(g) +S(s)
The element I will see suspended in the solution will be the sulphur which will become separated from the sodium thiosulphate during the experiment. It is yellow in colour.
Independent variables: I will change concentration of the Na2S2O3. I will change the ratios of liquids as shown in the table.
I do not need to go any lower in concentration than 0.04 mol. I am measuring at each 0.01mol change in concentration so as I can get an accurate graph with lots of readings.
For each concentration I will take two sets of results I will then take the average of these so that I can make it more accurate. On my graph I will plot the averages.
Safety
I will tie my hair back,
Wear goggles
Use a heat proof mat
Stand up when doing the experiment
Put bags under the desks
Keep the acid on the heat proof mat
Fair test
I will keep the equipment the same, use the same cross, have the same person waiting for it to disappear, same concentration of HCl, clean conical flask with distilled water each time, use distilled water, keep the temperature, same amount of stirring each time, and measure accurately.
Preliminary work
In my preliminary work I took these results:
I only had time to find the rate at two different concentration but from this I can tell that it is taking longer to react at the lower concentration. It took longer for the reaction to happen when the concentration was lower. This is because there were less particles colliding and therefore less successful collisions. The results were only marginally out, if my prediction was right then it should have been double the rate=double the concentration. This would have made the rate for 0.1 mol/dm3 0.014. The results I got were quite accurate as there was only a 5% difference between them this shows that it is a good method.
Method.
I will collect the equipment and check it all works.
Put the acid on the heat proof mat.
Put the burettes in the clamp stands and label them.(Na2S2O3 and H2O)
Using the funnel put I the Na2S2O3 into the burette with that label on it.
Then I let a little bit out of the bottom into the spare measuring flask to make sure that the bottom of the burette is full.
Check for air bubbles and then fill again to exactly 0 and then take out the funnel.
Do the same with the H2O burette.
Then I poured out the HCL for the whole experiment into a measuring flask and keep it on the heat proof mat.
Then I measured out the Na2S2O3 for the first measurement which will be the strongest concentration into a conical flask then add the H20 which there is none of for the first reading (50cm3 Na2S2O3 )
Measure out the HCL into a measuring cylinder.
Add the acid to the conical flask stir round once and then start the clock once it is on the cross on the heat proof mat.
Time until the person watching the solution can no longer see the cross through it then when they say to stop the clock.
Record the reading.
Wash the conical flask out with distilled water, re-set the clock, re-fill the two burettes and then do it again with the same concentration of Na2S2O3.
Then record this result and find the average of the two and the rate of the average result.
Then wash the conical flask out with distilled water, re-set the clock, re-fill the two burettes and do this for each of the concentrations from 0.1mol/dm3 to 0.04mol/dm3 at each 0.01mol/dm3 change in concentration. You must make sure that you wash out the conical flask well and with distilled water between each reaction.
I have done a trial run of this which I wrote up as my preliminary work which made sure that I knew how to conduct the experiment fairly and alerted us of any problems I may have.
Obtaining Evidence
Analysis
From my graphs I can see that there is a definite correlation between the time and the concentration. The graph shows that they are inversely proportional to each other as the line of best fit is a curve. The line between rate and concentration is a straight which shows that they are proportional. The graph shows that each time the concentration increases by 0.01moil/dm3 the rate increased by 0.00425-1.This means that they are proportional. This proves my prediction correct to the extent that they are proportional but I can not prove that they are directly proportional because the line on my graph does not pass through the origin which means that my results were not directly proportional. To improve on these results and to prove that it is double the rate = double the concentration I could try it at lower levels of concentration nearer to the origin. I stopped at 0.04 mol/dm3 because when it gets lower than that it would take a long time for the cross to dissapear. There were a few odd results which were due to the change in equipment because I could not use the same things in the next lesson and the first result of the second lesson is the one which is off of the line of best fit. I think this is also due to a change in temperature as I did not keep it at a constant temperature.
I can back up my results with the theory of collision between particles. This theory says that in order to produce an effective collision, reactant particles must possess some minimum amount of energy. This energy, used to initiate the reaction, is called the activation energy. For every sample of reactant particles there will be some that possess this amount of energy. The larger the sample, the greater the number of effective collisions, and the faster the rate of reaction. The number of particles possessing enough energy is dependent on the temperature of the reactants. If reactant particles do not possess the required activation energy when they collide, they bounce off each other without reacting.
Some chemical reactions also require that the reactant particles be in a particular orientation to produce an effective collision. Unless the reactant particles possess this orientation when they collide, the collision will not be an effective one.
This means that in my experiment when a sodium thiosulphate and a hydrochloric acid particle met they did not always react when they did not have enough activation energy. When the concentration of Sodium thiosulphate was increased then the number of collisions did too. If there were more collisions then there was more reactions because the chance of a collision being successful did not change but the number of collisions did. The rate and the concentration are directly proportional because if you double the number of particles this doubles the number of collisions which will double the rate of the reaction.
Evaluation
The results I obtained were fairly accurate. On the whole they fitted the line of best fit and the curve of best fit on the other graph. There were two results which did not fit the line of best fit. I thought about why these results were out. They occurred when we had a change of equipment, when we started again the next lesson we were not using the same equipment as we had been the lesson before which may have effected the accuracy of our results. The equipment we used was very accurate in measuring. We used pipettes and burettes with care and precision. The method we used could be improved. We were relying on someone to see when the cross disappeared which is not a very accurate way to carry out the experiment as they can easily make a mistake. To improve on this method we could use a data logger so that it is measured and plotted by a computer. Another way we could improve on the accuracy of our method would be to wait for the solution to reach a specified colour intensity, This would make it more accurate because it is very hard to judge exactly when the cross disappears but if you had a chart and just said when it was that colour it would make it much easier to judge. We could have been more accurate using our method by doing the whole experiment in one go so as to keep the same equipment. We could also have kept the experiment at a constant temperature as this probably effected the level of accuracy in our results as it is another factor which effects the rate of a reaction.
It would have been good to have done more repeats. Two tests were managed each time but if one had been wrong this could have dramatically changed the average time and therefore rate of reaction.
I could not prove that the rate graph was directly proportional to the concentration as it did not pass through the origin so if I were to carry out the experiment again I would like to see what happens with lower concentrations nearer to the origin although these would take a long time.
The results we obtained was enough to give us a conclusion as most of the results fitted the line and curve of best fit and showed a clear relationship with the concentration. We did it twice for each level of concentration and plotted the averages on the graph which made it more accurate. Another thing which made it may not have been accurate was the line and curve of best fit because they were done by hand.