*remember to label each concentration accordingly
-
Set your microscope up, put it on medium magnification. Do not turn it on yet because the light of the microscope can heat up the environment where you will be observing the Daphnia. It is important to try to keep the temperature of the experiment as stable as possible. Heat may modify the Daphnia heart rate, and the effect of heat on the heart rate is not the purpose of this experiment.
-
Now it is time to pick out one Daphnia from the glass or container where you put all of them in. It is important to use only one throughout this whole experiment because different animals may present variations in their response to different environments. With the open top pipette, try to pick out a Daphnia which is not too small, as it will be harder to observe the heart rate if it is small. Once you have managed to take one out, place it in the remaining empty Petri dish. Take the normal size syringe and very carefully suck the Daphnia in with as least water possible. The objective is to have the Daphnia right at the tip of the syringe. “Squirt” the Daphnia out into the cavity slide. It is very important to put the Daphnia in with the least water possible, in order to prevent it from moving too much. It is recommended to try to “squirt” it out with only one drop of water, as this will keep it alive, but immobile. Put the slide under the microscope. Turn the microscope on.
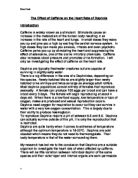
- Make sure you can see the Daphnia clearly under the microscope, once you are happy with the image, look for the heart:
7 is the heart.
The picture on the right is a magnified view of the heart.
If you can see the heart, and can keep track of its beating, put the Daphnia, with the normal sized, syringe into the 0% labelled Petri dish. Wash the microscope slide with water and dry it. Turn the microscope off.
- Keep the Daphnia in the Petri dish for 3 minutes, this lets it “adapt” do the conditions and also increases the probability of it surviving the whole experiment. With the normal size syringe take it out of the Petri dish and put it onto the microscope slide, make sure that it is practically immobile (by making sure that you squirted the least amount of water possible) and put it under the microscope. Turn the microscope on.
- Get the paper and marker ready. Look into the microscope and make sure you can count the heart beat. Get someone to count 15 seconds with the stop watch. During 15 seconds, tap the paper with the marker each time the heart beats, after this, count the number of dots on the paper. Multiply this number by four; this gives you the heart rate per minute. Record the result. Do this process 3 times in order to get 3 heart rates. Add the 3 heart rates and then divide the result by 3; this will give you the average of the Daphnia heart rate under those conditions. Keep the Daphnia under the microscope for a maximum of 2 minutes, because the heat of the light in the microscope could have effects on the experiment. Turn the microscope off after the count to prevent further heating caused by the light.
- Remove the slide from the microscope, and with the normal size syringe put the Daphnia into the 0.2% labelled Petri dish (wash the slide with water and dry it). Leave the Daphnia in the Petri dish for 3 minutes once again. After 3 minutes, use the normal sized syringe to put it onto the microscope slide. Repeat step 6 and record results.
-
Count the heart rate of the Daphnia when placed in all the concentrations. Work your way up from 0% to 0.2% to 0.4%, 0.6%, 0.8%. Make sure you rinse and dry the slide with the distilled water after each time. You must start from the lowest concentration up to the highest concentration because the Daphnia has to gradually adapt to the changes, you will be reducing the probability of it dying. Another reason for this is that if you start at the highest concentration, the impact on the Daphnia will be too dramatic and you will not see any trends once you try a lower concentration, it will have an effect of “intoxication”. Remember to repeat each count 3 times to obtain an average of the heart rate. Keep the Daphnia under the microscope during the same amount of time for each concentration, this will ensure that if there was any type of effect from the light under the microscope, all tests will be fair because they were under the exact same conditions. It is possible for the Daphnia to die during these tests; this is why you must have acquired a fair amount of Daphnia, in order to have back-ups.
- Repeat this experiment once or twice with different Daphnia, in this way you will be able to analyse any trends present in the experiment more accurately.
The effect of ethanol on the Daphnia heart rate
Analysis and evaluation
Looking at the graphs and table of results, it is fair to say that there is a clear trend in the way that ethanol affects the Daphnia heart rate; as the concentration of the ethanol in the Daphnia’s environment increases, its heart rate decreases (beats per minute). This decrease in heart rate can be seen immediately when the level of ethanol increases from 0% to 0.2%. Once I let the Daphnia adapt to higher levels of ethanol, the heart rate steadily continued to decrease. Its heart rate (average of both Daphnia) in water is 302 b/m; at the highest concentration of ethanol (0.8%) tested, its heart rate was 241 b/m. This is a significant drop in heart rate (61 b/pm), and it shows that ethanol does have a great effect on the heart rate of the Daphnia.
It is possible to make several observations on the response of the Daphnia to the increases in ethanol concentration. When using the graph that has the averages of both Daphnia heart rates, we can observe that the biggest decrease in heart rate is in the change from 0% ethanol conc. to 0.2% ethanol conc., from there onwards, the decrease in heart rate is relatively “uniform”. The fact that the biggest change in heart rate is at the beginning of the experiment is perhaps due to the fact that it is the most dramatic change in the environment for the Daphnia (from no ethanol at all, to 0.2%), from here onwards its heart rate changes at a relatively steady rate, probably because the Daphnia has already adapted to the fact that there is ethanol surrounding it, and therefore no more dramatic changes will occur. After doing the 0.2% concentration, the average decrease in heart rate per concentration increase (+0.2) is 9 b/m. Taking into account the first change, the average decrease would be 15 b/m. With the 9 b/m average decrease, it would be interesting to see if heart rate is approximately 241 b/m - 9 b/m (=232 b/m) at 1% ethanol concentration.
Why does an increase in ethanol concentration cause a steady decrease in heart rate? The answer to this question can be found by first looking at how the Daphnia’s heart rate is controlled, and then looking at how ethanol would affect this system. As the case in most animals, crustacean heart beats are regulated primarily by nerve impulses. In the case of crustaceans like the Daphnia, these impulses are generated by pacemaker neurons located in a group of nerve cells called the cardiac ganglion. The impulses are then transferred to larger follower neurons which carry the signal to the cardiac muscle, causing it to beat. Since the heart rate is the dependent variable in this experiment, we can assume that the ethanol is acting upon this system; the nerves involved in the heart rate are the ones being affected. How does the ethanol interfere with the nerves?
All cells have a type of protein attached to them in their cell membranes called receptor proteins. They allow communication between cells to occur. Nerves can receive communication from cells far away or from nerve cells near by. Cells far away secrete hormones, which find their way to the target nerve’s hormone receptors. Once these hormones attach to the receptor, changes in the nerve take place. The hormone-receptors, when activated, can change how quickly a nerve generates an impulse, or alter how fast the nerve passes impulses along. Some hormones increase heart rate and some decrease heart rate. Other receptors allow communication between adjacent nerve cells (such as between the pacemaker neurons and the follower neurons). Instead of hormones, the receptor binds to neurotransmitters. These receptors sometimes accidentally bind molecules they shouldn’t. The nerve fibers conducting pulses to the hearts of Daphnia may contain receptors that inappropriately bind to the ethanol causing a decrease in activity. This process coincides perfectly with the fact that ethanol is a depressant that decreases nervous activity, partly through interfering with neurotransmitters, and in turn decreasing heart rate.
In conclusion, increased levels of ethanol affect the regulation of heartbeat in Daphnia. As the concentration of ethanol increases, the heart rate decreases and patterns can be seen as to how the rate responds to changes in the environment. The Daphnia heart rate decreases in an average of 9 b/m as the concentration increases by 0.2%.