Errors and Improvements:
First of all, there was an error caused by the measuring cylinder which I used to collect the volume of oxygen. This is mainly because the scale division were as accurate as +/-1 cm³ but I could read as accurate as +/-0.5 cm³. However this scale of +/-0.5 cm³ was still too small to gain an accurate reading. This is because the larger the scale, the lower the percentage error.
For example at the temperature of 20°C after 30 seconds the volume of oxygen I collected was on average 0.85 cm³ (see results preliminary results table). Hence the percentage error was:
Percentage error = Smallest division × 100
Measured quantity
Smallest division of the measuring cylinder = +/-0.5cm³, this is the scale to which I could read as accurate to.
Measured quantity is the volume of oxygen = 0.85 cm³ on average collected.
Hence percentage error = 0.5 × 100
0.85
= 58.82352941%
= 58.8%
This percentage error of 58.8% is too high as the scale division was as accurate as to +/-1 cm³. Hence a huge percentage error suggests that the e measuring cylinder with a division scale of as accurate as +/-1 cm³ is not the right equipment to use in order to collect oxygen, this mainly because the measuring cylinder will give a great percentage error resulting in an unreliable and inaccurate results.
So therefore I will be using a burette instead of a measuring cylinder, mainly because the scale division is larger. This is because, the larger the scale division, the lower the percentage error which will result in providing me with more accurate and reliable results. The burette has a scale division as accurate to +/-0.1 cm³ hence the scale can be read as accurate to +/-0.05 cm³.
So if I use the same example which I used for measuring cylinder then the percentage error which will be given by using a burette will be:
Percentage error = Smallest division × 100
Measured quantity
Smallest division of the burette = +/-0.05cm³, this is the scale to which I will be able to read as accurate to.
Measured quantity is the volume of oxygen = 0.85 cm³ on average collected.
Hence percentage error = 0.05 × 100
0.85
= 5.882352941%
= 5.88%
This shows that the percentage error of the burette is 10 times less than the percentage error of the measuring cylinder. This is because:
Percentage error of measuring cylinder = 58.82352941%
Percentage error of burette = 5.882352941%
Hence: the difference = 58.82352941% (Percentage error of measuring cylinder)
5.882352941% (Percentage error of burette)
= 10
Therefore the percentage error given by the burette will be 10 times less than the percentage error given by the measuring cylinder when collecting oxygen. As result of this I will be using a burette to collect the volume of oxygen as a burette will provide more accurate results.
Another error in the preliminary experiment was that the temperature. This was because the temperature wasn’t kept constant because if the initial temperature of water was 40°C then by the end of the experiment, the temperature will decrease gradually. This is because I did not use specific equipment which would have maintained the temperature, which would have allowed me to gain more accurate and reliable result. This is because temperature increases the rate of reaction increase due to the kinetic energy gained by the hydrogen peroxide molecules and catalase enzyme. As result of greater kinetic energy, the particles move faster and faster moving particles collide more frequently, resulting in greater product, water and oxygen in this case being produced in a given time. So therefore a gradual decrease in temperature will mean an unfair test as temperature was a variable that should be controlled as the rate of reaction is dependant on the temperature.
So therefore in order to overcome this error, I will be using a thermostatically controlled water bath. This will help me maintain a temperature and keeping it constant throughout the experiment. This very important as the rate of reaction is dependant on temperature hence I will have to make sure that temperature is controlled. So therefore in order to limit the error by maintaining temperature at constant I will be using a thermostatically controlled water bath.
Another error which I determined by doing a preliminary experiment was that the syringe was used to insert the hydrogen peroxide into the boiling tube. This left a small gap which allowed some of the volume of oxygen produced to escape. As result of this I didn’t get the actual volume of oxygen produced.
So therefore, in order to solve this problem I will be using plasticine around the syringe and delivery tube, this I can make sure that the top of the bung is air tight, and gas escaping is as minimum as possible. Hence by doing this the volume of gas escaping through the gap will be much lower, As result of this a more accurate reading of the actual volume of oxygen produced.
Preliminary Results:
Results at 20°C:
Result at 30°C:
Results at 40°C:
For 20°C the line of regression: y = 0.026x + 0.0429
For 30°C the line of regression: y = 0.0294x + 0.1179
For 40°C the line of regression: y = 0.1036x + 3.9643
Prediction:
I predict that as the substrate concentration, the hydrogen peroxide concentration increases, the rate of reaction will also gradually increase. This is mainly because more hydrogen peroxide means that there is a greater chance of a substrate to collide with the enzyme, catalase which has the specific active site, which is complementary to hydrogen peroxide. Hence greater chance of frequent collision between catalase and hydrogen peroxide will mean that there will be more enzyme-substrate complex and more products produced in a given time. So therefore as hydrogen peroxide concentration increases, the affect on rate of reaction will be that it will also increase.
However I also predict that the rate of reaction will be constant at a point, known as V-max. This is because all active sites will be occupied hence excess hydrogen peroxide cannot bind to an active site of catalase. As result of this the enzyme, catalase will be the limiting factor resulting in a constant rate of reaction.
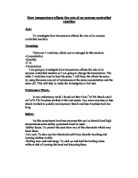
Lower concentration of Hydrogen Peroxide
Hydrogen Peroxide
Active site
CATALASE
The diagram above shows at a lower concentration there are a lower number of hydrogen peroxide molecules. As result of this there are less frequent collisions hence less product produced in a given time.
High concentration of Hydrogen Peroxide
Hydrogen Peroxide
Active site
CATALASE
The diagram above shows that at a high concentration there are a greater number of hydrogen peroxide molecules. As result of this there are more frequent collisions hence more products produced in a given time.
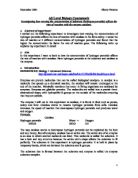
Predicted Graphs:
V-max
Rate of Reaction
(cm³/s)
Substrate concentration (mol/dm³)
The graph above shows that as the H2O2 concentration increases, the rate of reaction also increases. This is because if there is more substrate, H2O2 then it will mean that there will be a greater chance of frequent collisions between the H2O2 and catalase. As result of more frequent collisions, there will be more products, water and oxygen produced in a given time. However the optimum rate of reaction is at V-max, this is when all the catalyse active sites are occupied and as result of this no substrate can bind to the active site. Hence the enzyme concentration will be the limiting factor causing a constant rate of reaction.
Volume of
oxygen
(cm³)
Time (seconds)
The graph above shows that as the time increases, the H2O2 decreases. This is due to the fact that the catalase is breaking down the substrate, H2O2. As result of more H2O2 broken down, there will be more product, water and oxygen produced.
Variables:
Variables are factors which would affect the experiment. Some variables can be controlled such as temperature whereas some variables cannot be controlled such as rate of reaction.
Apparatus:
The equipment which I will require in order to carry out the experiment is:
Method:
- Firstly get all the equipment required.
- Wear goggles and follow other safety precautions.
- First of all, using a cork borer (a little smaller in diameter than the boiling tube), cut a cylinder of potato.
- Use the knife (scalpel) to cut the potato cylinder into 1mm thick discs.
- Place 3 cm³ of pH7 buffer solution in a watch glass.
- Place the potato discs in the watch glass, which contains ph7 solution. This will keep the potato discs moist.
- Place ten potato discs in a boiling tube with 3 cm³ of pH7 solution and cover it with a bung with a gas deliver tube.
- Place the boiling tube containing potato discs and pH7 solution in the thermostatically controlled water bath, at the temperature of 35°C. This will allow all discs to reach the correct temperature and remain at constant temperature throughout the experiment.
- Get a 250 cm³ beaker/container and fill it up to around 200 cm³ with water.
- Get a 50 cm³ burette and fill it up with water as close to 0.00 cm³ as possible.
- Set up clamp and stand so the burette is fixed and secure. This will hold the burette still hence easier to take readings.
- Take the initial reading of where the burette is filled up to.
- Place the burette inverted and allow the gas deliver tube from the boiling tube to insert the burette.
- Make sure that the delivery tube is inserted in the burette.
- Place Hydrogen peroxide in a boiling tube and then in the thermostatically controlled water bath so it also reaches the same temperature.
- By using a 10 cm³ syringe covered by plasticine place 10 cm³ of hydrogen peroxide of 2.0M into the boiling tube (containing pH7 buffer solution and potato discs) through the bung.
- Start the stopwatch.
- Take reading from the burette after every 20 seconds.
- Record the volume of oxygen produced by 2.0M hydrogen peroxide after every 20 seconds for 3 minutes.
- Repeat the experiment again by using the dilution table below at different concentrations.
- Repeat one more time for each of the concentrations.
Method of producing Hydrogen peroxide:
Reference:
The method of producing Hydrogen peroxide to a concentration of 2 mol/dm³:
Chemical Formula = H2O2.
Hence Molar Mass = (1 × 2) + (16 × 2)
= 2 + 32
= 34.0 g/mol
Therefore 2 moles of Hydrogen peroxide has to be dissolved in 1 dm³ (1000 cm³) of water in order to get a concentration of 2 mol/dm³. Hence because 2 moles is:
Number of moles = Mass
Molar Mass
Hence: 2 moles = Mass
34.0g/mol
Therefore Mass = 2 moles × 34.0g/mol
= 68.0g
So therefore in order to make a hydrogen peroxide to a concentration of 2 mol/dm³, the mass of hydrogen peroxide required is 68.0g which is then dissolved in 1000 cm³ water.
This calculation can also be proved by the following equation:
Number of moles = Concentration × Volume
1000
= 2 mol/dm³ × 1000 cm³
1000
= 2 mol/dm³ × 1 dm³
= 2 moles
Dilution Table:
I will be provided with hydrogen peroxide, with a molarity (concentration) of 2.0mol/dm³ (2M). I will be using 20 cm³ as total volume of hydrogen peroxide an water together. The dilution table below will show the quantity of water and hydrogen peroxide used in the experiment. This is because I will have to dilute the provided 2mol/dm³ to gain different concentrations of hydrogen peroxide which I will use in the experiment.
Measurements and errors:
Burette:
A burette is required in order to collect the volume of oxygen which is produced by the reaction in which hydrogen peroxide is broken down by catalase to produce water and oxygen. Hence the burette is needed to determine the volume of oxygen produced. The scale on the burette is accurate to +/- 0.1 cm³ hence I would be able to read between the scales which will make the reading to 0.05 cm³. So therefore because I will be able to read as accurate as +/- 0.05 cm³ it will mean that the percentage error will be:
Percentage error = Smallest division × 100
Measured quantity
Hence percentage error of the burette will be: Percentage error = 0.05 × 100
Volume of oxygen
Measuring cylinder:
A measuring cylinder is needed in order to measure the volume of water. This is because I will be doing the experiment on different concentrations of hydrogen peroxide. Hence I will need to dilute the hydrogen peroxide to different concentrations before using it in an experiment. As result of this a certain volume of water will be required in order to dilute the hydrogen peroxide to specific extent.
Syringe:
I will need a syringe for this experiment because I have to measure 5 cm³ of hydrogen peroxide. This is because 5 cm³ of hydrogen peroxide and its dilutions will be added to the potato which contains the enzyme catalase that will break down the hydrogen peroxide. Hence to make it a fair and reliable test, equal amount or volume of hydrogen peroxide (of different concentrations) should be added each time.
Safety Precautions:
- Wear goggles for safety.
- Hydrogen peroxide is corrosive hence gloves should be worn while handling with solution.
- Hydrogen peroxide is an oxidizing agent.
- Tables should be clear to allow maximum area for the set up of apparatus.
- Chairs/stools should be tucked in under the table.
- If any accidents report to teacher straight away.
Rate of Reaction:
Regression Line
“The least square regression line is drawn through the points representing the observations in such a way that the sum of the squares of the vertical distances between the line and the points plotted is minimised.”
Reference: Edexcel- Statistics 1
x = mean value of x
y = mean value of y
yi = Values of y
xi= Values of x
n = Number of Values or Samples
r = Correlation Co Efficient
S = Sample
∑ = Sum of
∑ yi = Sum of values of y
∑ xi = Sum of values of x
∑ xiyi = Sum of xy
∑ yi ² = Sum of y²
∑ xi ² = Sum of x²
Formulas
Sxy = ∑ xiyi - ∑ xiyi
n
Sxx = ∑ xi ² - (∑ xi ²)
n
Syy = ∑ yi ² - (∑ yi ²)
n
r = Sxy
SxxSyy
OR
Sxy = ∑ (xi - x) (yi - y)
Sxx = ∑ (xi – x) ²
Syy = ∑ (yi – y) ²
r = Sxy = ∑ (xi - x) (yi – y)
√ (SxxSyy) √ ∑ (xi – x) ² ∑ (yi – y) ²)
The least squares regression line is a line of best fit which ensures that the sum of the squares of the vertical distance between the line and the plotted points is minimised
By using advanced pure mathematics it can be worked out that the equation of the regression line of “y” and “x” given by:
y = â + ßx
Where ß = Sxy and â = y - ßx
Sxx
Where x and y are the mean values for “x” and “y”
x = ∑ xi and y = ∑ yi
n n
ß is the slope of the line.
â is the intercept (the value of y when x = 0)
x is the independent variable.
y is the dependent variable.
The equation for the least square regression line for the rate of reaction is:
x = ∑ xi
n
Hence x = 6.8
6
= 1.133333333
= 1.13
y = ∑ yi
n
So y = 0.6769
6
= 0.112816666
= 0.113
ß = Sxy
Sxx
So therefore ß = 0.97088
9.68
= 0.10029752
= 0.100
â = y - ßx
Hence â = 0.113 - (0.100 × 1.13)
= 0.113 – 0.113
= 0
Line of regression: y = 0.100x – 0.00
Analysis:
In my hypothesis I predicted that the rate of reaction would increase with increase of Hydrogen peroxide concentration. The graphs that have been plotted were on the y-axis the rate of reaction in cm³/s and on the x-axis concentration of hydrogen peroxide in mol/dm³. The graph is a straight line hence there is a continuous increase in the rate of reaction.
The initial rates of reaction were found by finding the gradient of the graph at 0 seconds. The initial rates of reaction were found at 0.20 mol/dm³, 0.80 mol/dm³, 1.00 mol/dm³, 1.20 mol/dm³, 1.60 mol/dm³ and 2.00 mol/dm³. At 0.20 mol/dm the rate of reaction was only 0.0355 cm³/sec however when the concentration of Hydrogen
peroxide was 2.00 mol/dm³, the maximum concentration used for the experiment, the rate of reaction was 0.208 cm³/sec. This establishes my initial hypothesis that the rate of reaction increases with increase in hydrogen peroxide concentration.
So therefore the graph and the results support my prediction as I had predicted that an increase in the substrate concentration, Hydrogen peroxide will mean an increase in the rate of reaction. This is because more hydrogen peroxide means that there is a greater chance of a substrate to collide with the enzyme, catalase which has the specific active site, which is complementary to hydrogen peroxide. Hence greater chance of frequent collision between catalase and hydrogen peroxide will mean that there will be more enzyme-substrate complex and more products, water and oxygen produced in a given time. This can be analysed by the rate of reaction at 0.2 mol/dm³ and 2.00 mol/dm³, because the difference between the rates of reaction is 0.1725 cm³/s, which means that an increase in concentration has lead to the increase in the rate of reaction. This is mainly due to the fact that there are a greater number of hydrogen peroxide molecules as concentration increases, which leads to more frequent collisions as there is a greater probability of colliding and binding to the catalase active site. This will mean that more enzyme-substrate complex and more products, oxygen and water produced in a given time. So therefore as the concentration of Hydrogen peroxide increases, the rate of reaction will also increase. So therefore this shows that the results, which I have obtained, show some form of reflection to what I had predicted.
Overall, my results and graph support what I had predicted to a moderate extent I had outlined in my prediction that as there is an increase in hydrogen peroxide concentration, the rate of reaction will also increase. This is due to the fact that an increase in concentration means that there will be an increase in the number of hydrogen peroxide molecules. This will therefore result in more frequent collision, leading to more products, oxygen and water produced in the provided time.
So therefore as the concentration of Hydrogen peroxide increases, it enables more molecules to collide more frequently in the right orientation in the time provided. Hence the increase in concentration would mean an increase in the rate of reaction.
Collision Theory:
Collision Theory explains how chemical reactions take place and how the rates of reactions are affected. For a reaction to occur, particles must collide successfully for which they have to collide and hit the solid particles in the right place at the right speed. If the collision causes a chemical change it is referred to as a fruitful collision. The fruitful collisions have enough energy (activation energy) at the moment of collision to break the existing bonds and form new bonds, consequential in the products of the reaction. Increasing the concentration of the reactants and raising the temperature bring about more collisions and therefore more fruitful collisions, increasing the rate of reaction.
Also a chemical reaction can only occur between particles when they collide (hit each other). Particles may be atoms, ions or molecules. There is a minimum amount of energy which colliding particles need in order to react with each other. If the colliding particles have less than this minimum energy then they just bounce off each other and no reaction occurs. This minimum energy is called the activation energy. The faster the particles are going, the more energy they have. Fast moving particles are more likely to react when they collide. You can make particles move more quickly by heating them up (raising the temperature).
Overall the collision theory simply outlines that rate of reaction is depends on how often and how hard the reacting particles collide with each other. Therefore the result of a collision can only be obtained if the particles collide which would enable them to react, and they have to collide hard enough in order to make a successful collision. Hence more collisions can increase the rate of reaction and there are four factors, which can cause more collision and increase in rate of reaction. These four factors are temperature, concentration, surface area and catalyst, all four of these factors speed up the rate of collision hence increase then rate of reaction.
Evaluation:
I am able to observe from my graphs that I have gained a few anomalous results. This outlines that there was an error of some kind, which resulted in the production of anomalous results. There could have been several factors such as the hydrogen peroxide not diluted to the exact extent, which resulted into the anomalous results. This could have been the case due to the human error made in reading the scale on the measuring cylinder when measuring the volume of distilled water which was to be used in order to dilute the Hydrogen peroxide.
The percentage error caused by the measuring cylinder is:
As you can see from the table above, there is an error in measuring the volume of water using a 50 cm³ measuring cylinder which may have lead to the anomalous results.
Another reason for the anomalous result could be the measurement of the volume of oxygen collected in the burette. This is mainly because there could have been an error in reading the measurement which results in anomalous results.
The percentage error caused by the burette is:
As you can see from the table above, there is an error in measuring the volume of oxygen collected using a 50 cm³ burette which may have lead to the anomalous results.
Reliability:
In order to make sure that my results are reliable I will be repeating the experiment for all concentrations twice. This would outline the difference or similarity between the two pair of results obtained from each concentration. After I have obtained to results for each of the concentration of hydrogen peroxide then I will proceed in my investigation and add the two results for each concentration and divide it by 2 to obtain the volume of oxygen collected in cm³.
I will also carry out the experiment under the same conditions so there is no variation in temperature or anything that will affect the rate of reaction.
Fair Test:
There are certain variables, which I would need to keep the same in order to carry out the experiment because the change of those particular variables may lead to unfair results. Those variables, which are required to be controlled throughout the experiment, are the volume of catalase and hydrogen peroxide used. I will only use 10 cm³ of catalase and 20 cm³ of hydrogen peroxide throughout the experiment in order to obtain reliable results and also allow the same volume of reactants to react with the at different concentrations of hydrogen peroxide. This is important because the more catalyse used the faster the rate of reaction hence the concentration of the catalase and the volume of catalase used for each concentration is to remain the same.
Blank Results Table:
A blank result table to show the volume of oxygen collected (cm³) when different concentrations of hydrogen peroxide are catalysed by catalase.