Evolution can explain why these plants are here today. To find what exactly dose evolution mean I look in “The Collaborative International Dictionary of English v.0.48” This is the definicgen I found in their:
“A general name for the history of the steps by which any living organism has acquired the morphological and physiological characters which distinguish it; a gradual unfolding of successive phases of growth or development.”
I think that this is a very good description, it makes clear that evolution is made up of many steps that lead to the development of the organism. Also it mentions that these steps can only lead to the development, or adaptation to the environment. The only think that this definichen dose not say that all of this is just a theory. It was introduced and popularised by Charles Darwin, he had to struggle to be get attention for 20 years until 1856, when his book 'On the Origin of Species' was printed. Their are many other theories about the way the life developed, however most scientist believe that the theory of evolution is the right theory because it has the most experiment that support it. According to this theory all the living organisms will adapt to the maximum of their ability to suit the environment around. The main adaptation for the plants that get mowed regularly is to be able to reproduce very fast, in between that it gets mowed. Usually to do that a flower is needed to produce seeds that will at the end, hopefully, into a other plant. Perhaps their will be plant that will be able to multiply on their own, this is one of the possible adaptations that will help this kind plants to survive.
I expect to find that all of the plants will be adapted, but most likly in different ways. Because their will be high competition with the fast growing grass the plants that I will find the most have adaptations to successfully compete. Natural selection for many hundred million years would give the plants their adaptations.
Preliminary work
In this experiment I did not have to have a long preliminary. I took me about half of the lesson to collect all the data I needed. The first think that I used was a trundle well to measure the the two lengths of the rugby pinch. The distances that I found were 66 and 97 meters. Jurying measuring I had realized how hard it is to keep the trundle well going straight. A number of times I did lose count and had to start everything again. The lines that were marked very clear also, they were straight and this helped a lot to push the trundle well exactly on the line. Also in my preliminary work I have looked at what kinds of plants their were to be able to draw a table and be ready to take my samples. This turned out to be very important because I only had enough time to do 10 samples in the actual practical. These are the plants that I have found on the fields (except grass):
- Plantain
- Daisy
- Buttercups
- Clover
- D L (dandy lions)
I did not have a lot of time to look at the plants in detail, maybe these are not the only plants that their are. I have found that it looks like their is too much clover, and it is not possible to count it all. To solve this problem we, in our group have decided to take a sample within a sample. To make it easy we will bring four 10 cm rulers and count the clovers in their and then simply times the number by 100, because their are going to be 100 square of 10 by 10 cm in the 1 by 1 m square. I do not think that to take this sample randomly would be a good idea, this would take up too much time, so each time I will take the 10 cm sample in the middle of the square.
Also I am able to work out the quardinates for random sample because I know what the maximum distance for the quardinats. So I will need to generate random numbers using my calculator, these are going to be four number, the firs two will show the distance that I will measure from the shorter side of the rugby pitch and the second two digit number is going to represent the distance on the longer side. I have found that I will not only have to generate random number but also re-arrange them into a right form to be able to use them as quardinates. I found the the calculator generates three digital numbers and I need four digital once. To solve this I rought the number generated in a line and toke thes figures in fours. This is the firs part of the numbers, the quardinates that did not suit the feild were just left out.
818, 814, 726, 709, 327, 543, 495, 402: These are the numbers that were generated.
81;88, 14;72 67;09, 32;75, 43;49, 54;02: The sets of quardinates that did not suit the sizes of the rugby pitch are marked in gray, here I give the first 4 quardinates that I used, I have worked out 15 in total but only used 10 at the practical. I do not see a need to present them to you, as they do not make any difference now.
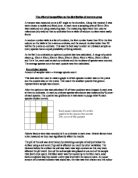
Diagram
Fair Test
Now when I finally decided on the method that I will use I can review if it is going to be a fair test or not. Of course I what my experiment to be as fair as possible, but I have curtain limits that are set and they limit at how fair I can my experiment. Firstly I have tried to select the most appropriate equipment out of what ever was available. The best would be to use a set 1 by 1 meters square, buy it was not available. This may lead to the area tested not being the same every time. There was nothing better then a trundle wheel as well. Also there was no better method of estimating the plants in the school fields then to take sample of the rugby pitch. We would not have enough time to take any more that would represent the rest of the total population. Counting the plants in the samples is to the best way that their is, it can lead to miscounting, but this fully depends on the person that is counting the plants, here human errors are impossible to illuminate. There no variables that I will change or keep the same. To make the experiment accurate I will try to get each person to count their own kind of plant, this can change human errors to systematic and this can make my result more fair when I will compeer them. The string and ruler too will be kept the same to make sure that the area is the same all the times as far as possible.
Results
My original table is in the appendix. This is its copy with the average and the total, I had to re-arrange it to fit on these page.
I found that counting Clover in the 10 cm by 10 cm sample was very useful because in many quadrants there was a huge number of clovers, as you can see from most of the estimations. The number of clovers in the 9th quadrant is not a miss print. I found that in this quadrant I could count it without the sample in the sample because there were be so few. With other kinds of plants there was not always a similar result, too. This dose not have to mean that the results are unreliable, because it all depend on the quadrants and I did not even expect all the results to be similar. This just indicates to me that the school field do not have the plant population distributed evenly over them.
Analysis
Firstly I will show how I worked out some of the averages in the table above. The total was calculated by adding all the numbers of plants that were counted in each quadrant. This was a necessary step to calculating the averages. Here is an exaple of how I calculated the total, this is for the Plantain:
9+18+21+18+4+5+30+20+6+0=131
After calculating this for all the different kinds of plants I was able to work out the Average. This was simply dividing the total by the number of samples, in this case; 10. I will show an example of how I did this; this is how I worked-out the average for the Daisies:
169/ 10=16.9
The finally I worked out was the total estimate of the plants on the rugby pitch. This was timsing the average number of plants by the area. Really this should have been the number of quadrates on the pitch, but in this case these figures were the same because the quadrates were 1 m2. The area of the rugby pitch is
66* 97= 6402
In this example I will user the average of buttercups:
0.9* 6402= 5, 672
At the practical I have tried to make as much observations as it was possible. I can see that the numbers of plants are very different, some plants were found in a grater numbers then others. The 4 plants, except clover are all fairly different, but when looking at the numbers of clovers the number of other plants looks small and very similar. For the clover to be so out standing their must be a numbers of differences that make it different from all the other plants. I will look at the possible reasons for this later. This is the rank order of the different plants, the once that I found the most are at the top, and this comes down to the plants that I have found the least.
- Clover
- Daisy
- Plantain
- Dandy Lyons
- Buttercups
The graph that I drew shows this order very clearly, the highest bars are highest number of plant. But these bars should not be compeered one to another in terms of how many times is this bar, bigger then the other one. This is because I have used a symbol that shows that a part of the scale was misted out, this is to allow me to use a bigger scale and make my graph more accurate. I think that it is more important to have an accurate graph, with bar not proportional to each other, then to have inaccurate but proportional bars.
The patter that I have discoursed above are not the only once that I have noticed in my results. When their are more daisies then average then their are less buttercups and when there are more buttercups then average then their less daisies then their average. This is true for all quadretes except the 4th one. I think when 9 out of 10 show similar results then this could be trusted. This tells us about the conditions in which these plants prefer to grow, about their adaptations. It tells us that the plants above prefer conditions that are almost opposite. This gave me the idea about the field being different even in the nearest quadrants. Also I have noticed, when doing the practical, that that the field is not straight, it is very bumpy. For example I have observed that quadrant number 5 was in an area that looked a lot like a dried up puddle. It did not rain enough to fill a puddle this sizes for a very long time, so it is probably left from last year. The number of clovers and daisies in this quadrant is very high, much higher then in any other and in the average. I do not think that it could have been their when the puddle was full, and it probably was because of the rainy previous year. All of this evidence suggests that the plant population is effected by the environmental factors.
Also this suggest that the plants named above are very fast at multiplying and can multiply to fill the new available space (when puddle dried up), quicker then other plants. So I looked at these plants and found out that clover reproduces asexually. This means that the plant con reproduce without flowering because it dose not need to get genetic information from other plants. The plant would just clone itself. This is the definition of asexual in the ‘Collins English Dictionary’:
“1. Having no apparent sex or sex organs.
2. Not involved the function of male and female gametes as in vegetative reproduction”
This means that clover would be able to reproduce without flowers, this would take less time and would not be stopped after mowing. The fact that the clover id very short and low-laying means that the plants wound gat less damage after moving and people standing on them. This is the only plan that can reproduce asexually, so it an anomalous result. The fact that this plant is smaller also means that physically more plants can fit in the same space then all the other plants that are much larger then clover. This explains why I found that there were more clover then any other plant, it simply had the most suitable adaptations.
The buttercups were founds in the smallest number. I think that this is a direct result of this being the tallest plant of all the once found on the field. The buttercup that I did find had very often the ends chopped off. This support the idea that the reason for these plants being so few is that it is their size. The rank order in which I paced the plants in the number that I have found them on the field is also the rank from the biggest to the smallest plant. This is most likely the reason behind the order in which the plants are found on the fields. Some adaptations help some of the plants like clover to multiply and they are found in greater number.
I am very surprised to find that their were so few dandy lions. I know that I is very hard to get rid of them in the garden, even is part of the route is left in the ground it will soon grow into a new plant. The reason that I can explain this by is the unsuitable environmental factors. If the whether was not suitable, for example if it was too dry then this could have coursed the dandy lions not to multiply.
The prediction that I made in the planning was quite similar to what I have found in my practical. The main difference is that I did not think that weather could have effected the plant population. I though that it will mainly be adaptations. It turned to be both of them. I also did not think that there are going to be so many different plants, the field looked green and I thought that I will be mainly grass.
Evaluation
Now I am going to evaluate my method and my results. In the fair test I said that the method and the quality of results where limited by different factors, the main being time. I also said that the method that I used was changed to try to make my results as accurate as possible. This is true, the method that I used could not be improved in many way. This doesn't mean that this was the best I could think of, it just means that the limiting factors did not allow me to improve it. The equipment could have been much better, for example. The trundle wheel was not a very accurate measuring instrument, all the efforts to keep it going straight did not always meant that it did. To me the dimensions of the rugby pitch look quite strange. The distances are very close to 100 and 70 meters, and maybe this is what they really are, it is very strange to have these distances in the rugby pitch when all the other sports pitches have their fields measuring more straight forward. This looks exspechially true because each time the distance was smaller then the distances, so this looks like a systematic mistake. However I think that the only possibility that can explain why the distance of the rugby pitch is that it was measured out in other units of measure , like feet, and it turned out so strange because we tried to measure it in meters. This is something that should have been investigated before we did the practical, in the preliminary work.
I also found that quadrant took quite a lot of time to spread out and keep a square form until all the plants are counted. However the counting of each and individual plant took most of the time and this is one of the things that I could have changed. It would be hard to measure out the distances from the (0;0) point any quicker, but the counting could br replaced by a much quicker method. The different method would be to estimate how often each plant is found in all the quadrants. This method uses the A, C, F, O and R termanoligey. A stands for abundant, C- common, F- frequent, O- occasional and R- rare. This method would not give more accurate results for each individual quadrant, but using it we would have been able to do many more sample and this could have made my results more reliable. I think that this could be very useful because 10 quadrants is only about 0.16% of all the rugby pitch. Now I think that this is not enough top make a good conclusion about the total population of the field even if it was quite random. I think that the samples that I took were as randomly selected as possible but there were simply not enough of them.
There is an other method, or even extension to the the calculations that I did, this is to look at what area is covered by the different plants. This is would equal out the big difference between the number of small plants like clover and all the other plants that are much bigger. This would give different results from the once that I have now, it even my turn out that clover takes up less surface area then other plants. One possibility was to see what area of each plant is taken in each quadrants, but again this would take too much time and we would be able to do even less samples. Another way to do this was to measure and work out the average area each plant, only taking a small number of plants, and then the average could be multiplied by the total number of plants and this would give a more accurate results in less time. This result would even out the differences and make me able to compeer the plants in a whole new different way.
Their is another think that I would not be able to change or improve. I only sampled one rugby pitch and it dose not represent all of the school fields. I cannot change this because this is the only way in which I am able to quickly collect random results and work out the total area of the area in which the samples are taken. Maybe the results can give us some idea about the rest of the fields in the school ground but not about the banking. I, with my group have looked at what kinds of plant grow on the banking in the school. Firstly their are a big number of trees and this is not taking into account, in our results. Really our results only show part of the plant population of out school. We also looked at the grass and what kind of plants grow among it. The grass doesn't get moved their, and is the tallest it can grow and is yellow. However we did not find any plants among it, the grass covered all of the surface. This turned my view about mowing, it actually not only chops off plants, but helps them to survive among grass, without it grass takes over and leads to all other plants not surviving. This external factor may hinder the plants in some way but without it they are not able to compete successfully, they are adapted to survive with mowing, and die without it.
My plan is very clear and easy to follow but I don't think that if anyone was to attempt it they would get the same results, if they use their own quardinates. This is not because of any incertansies in the plant, but because of lack in number of samples, I cannot trust my evidence. The results are as fair as I could get them, I think that the calculator gives random numbers and my quardinates do look evenly spread. There were some camomile on the rugby pitch, not in our sample, but still it shows that the plants may not only be counted wrongly, but also not all kinds of plants were taken into account. This shows that the samples we took were defiantly not enough because not even all kinds of plants were seen in the samples.
There are a lot of thinks that can extend this investigation. I would do a lot more samples, to get at least 1% of the whole area. I think that this is the absolute minimum that could give reliable evidence and idea about the rest of the area. I good idea would to be samples on other rugby pitches or other fields. Counting the big trees would not take a lot of time but would give a better idea about the whole area. Samples from the other area, like banking could be taken, it is not only un-cut grass but many other plants that I am struggling to name. I found out that weather effects the population of plants, to do this we would need to take the sample in different year or even all year round. It would be interesting to see how the population changes in different seasons and weather conditions. We have seen that mowing is one factor that effected the plant population may be their are many more. Acid rain could be effecting it or other things that we study in science. One more thing is, that we could compeer the population of our school to other schools, and see which one gives more attention to natural resources. All of this is relatyively possible to do but it would take up too much time, that we do not have.