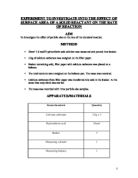
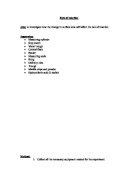
APPARATUS/MATERIALS
RESULTS
Table 1
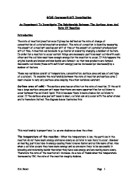
In this experiment, calcium carbonate was reacted with hydrochloric acid, which produces carbon dioxide and water.
Hydrochloric acid + Calcium carbonate → calcium chloride + Carbon dioxide + Water
HCl + CaCO3 → CaCl2 + CO2 + H2O
Graph A
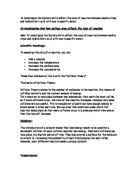
The above experiment was performed with three different sizes of calcium carbonate. The results of each sample were shown in table 1. It was made sure that every sample gets the same amount of acid and time to react. The readings in table 1 were plotted in graph A for further analysis.
CONCLUSIONS
The graph A explains the effect of surface area on the rate of chemical reaction. The large pieces are represented by blue line. The rate of reaction for the large piece was initially slower as compared to the other two samples. The reaction was constant for 45 seconds then it started to increase as more surface area was exposed to acid. The total mass lost was 0.2g.
The medium pieces are represented by the pink line. Initially the rate of reaction was much quicker as compared to the large piece of calcium carbonate. This was because more surface area was exposed to acid for reaction. Medium pieces reacted faster then larger pieces. The total mass lost for medium pieces was 0.25g.
The small pieces of calcium carbonate are represented by yellow line. As it can be seen from graph A that initially smaller pieces reacted faster then other two samples. The rate of reaction was very fast and more calcium carbonate was reacted with acid. This was because the more surface area was exposed to acid which eventually increased the rate of reaction. The total mass lost for small pieces was 0.311g.
According to the above discussion which is based on readings plotted in graph A, it can be concluded that small sample of calcium carbonate reacted more efficiently then other two samples. Therefore, it can be concluded that if more surface area is exposed to acid, there will be more rate of chemical reaction.
Smaller the pieces faster the rate of reaction