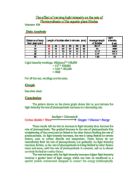
Predicted Graph:
Variables: I could have investigated various other input variables, I must know ensure these are kept constant throughout the experiment to keep it a fair test. These variables are carbon dioxide, amount of pondweed and temperature. I need to keep the amount of carbon dioxide the same because the higher the concentration of carbon dioxide, the higher the rate of photosynthesis, and if this changes during the course of the experiment then my results will be inaccurate. I need to keep the amount of pondweed constant because the larger the pondweed the larger the surface area available for photosynthesis to take place – therefore if this should change during the experiment then my results will be affected dramatically by this. Also, it is important to keep the temperature the same (25ºC) because this is the optimum temperature for photosynthesis to take place. Any higher and the enzymes will become denatured and photosynthesis will not be able to take place. Also, should the temperature constantly keep changing then the results will be invalid.
Measurements: For this experiment, the input variable that I am going to be measuring the light intensity. However, due to lack of resources I am unable to measure light intensity and so shall rely on the distance between the plant and the light source as an alternative. I shall use a metre ruler to measure every ten centimetres (I shall take ten measurements altogether). I will of course be repeating each one three times to ensure accuracy. The output variable that I am going to be measuring is the amount of oxygen released from the plant. I have decided to count the number of oxygen bubbles as my measurement method as a result of my preliminary work. I could have measured the amount of starch present (as this would also tell me the changes in rate of photosynthesis) however this would have been a lot more complex and so I opted to measure oxygen.
Preliminary Work: I decided to carry out a trial run of the experiment to decide on methods and equipment. I tested the various methods measuring the amount of oxygen released which included using a gas syringe, capillary tubing and the counting bubbles method. I found that there was not enough pressure to use the gas syringe effectively and the capillary tubing was to complicated compare with the “counting bubbles” method that provided equally accurate results.
I also used a computer simulation to see what results to expect from the actual experiment. The results were as follows:
Safety Precautions: As with all experiment, safety is crucial. Every experiment possesses some form of danger and through these guidelines I hope the risk of danger will be minimised:
- In the event that there are any spills, paper towels must be kept by at all times as any uncleared spills are a slipping hazard to others.
- When placing plug of lamp into the electrical socket, make sure hands are completely dry to minimise risk of electric shock.
- Any breakage’s should be reported immediately, especially thermometers as they contain mercury which is poisonous.
Apparatus:
- Lamp
- Clamp
- Metre Ruler
- Stop Watch
- Thermometer
- Boiling Tube
- Small spatula
- Large beaker
- 3cm piece of pondweed
- Beaker
- 25ºC water
- Sodium hydrogen Carbonate
- Two drops of detergent
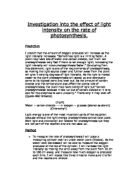
Diagram:
Method: First I will set out the equipment as shown in the diagram above. Then, I shall measure 750 ml of water into a beaker making sure the temperature is 25ºC. I shall then cut 3cm of pondweed and place in a boiling tube with the cut end facing upwards. I shall do this because if the cut end was facing downwards then it would be very difficult to count the bubbles and so my results would be inaccurate. Using the small spatula I shall measure out the Sodium Hydrogen Carbonate and put into the boiling tube whilst stirring it to let it fully dissolve. I will add Sodium Hydrogen Carbonate as it releases carbon dioxide, and carbon dioxide is important in photosynthesis - I need to make sure that the amount I add remains constant otherwise it would not be a fair test.I shall then add two drops of detergent to encourage the bubbles to stick together and make them easier to count. I shall then set up the lamp and measure out 100cm with my metre ruler, ready to being the experiment. I shall in total try 10 different distances and each experiment will last for five minutes; I shall use a stopwatch to ensure this is exact. I shall repeat each one three times, and my final result table will be an average result of the three.
Results:
Analysis: As you can see from my graph, my experiment was very successful. My results follow the inverse square law theory that is that as the distance doubles, the amount of oxygen decreases by one quarter. Also, my initial prediction has been proven correct, as it is clear from the graph that the rate of photosynthesis increases steadily until a certain point were it levels out, as a result of the limiting factors.
Evaluation: There is a high standard of accuracy in my experiment that is shown in the almost complete smooth curve of my graph. There were very slight anomalous results in that a few results were slightly off pattern, I feel this is because I averaged the three results and so rounding them up/down altered them slightly. The variables were controlled very well, the temperature was kept constant and the carbon dioxide remained the same and the amount of pondweed was always measured. However, the pondweed did change so that could have altered the results slightly (some pieces had larger leaves than others did which created a bigger surface area for example). I feel that if I was to repeat this experiment again, I would not average results as this does not give accurate enough reading, and I would possibly consider trying another method of measuring the rate of photosynthesis.
Abbie Taylor 10KG