Background Theory
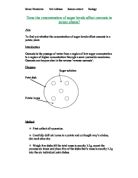
Osmosis (from the Greek word ‘to collide’ or ‘to hit’) is the movement of water through a partially permeable membrane (i.e. a piece of Visking tubing) from a lower concentration to a higher concentration. In the diagram below, the blue circles represent water (H2O) molecules, and the orange rimmed ones represent sugar (C12H22O11) molecules. The dotted line represents a piece of Visking tubing, and the red arrows show the direction of the water molecules.
The reason that water can travel through the partially permeable membrane is that there are tiny gaps between the cells in the membrane. For example, in the diagram below, we can see water molecules (the aqua circles) travelling through a gap between the cells. The water will travel towards the side with which has a higher concentration.
Osmosis is important to plants in particular. They gain water by osmosis through their roots. Water moves into plant cells by osmosis, making them turgid so they that able to hold the plant upright. If the plant does not gain enough water, then the cells become flaccid, hence the plant wilts.
Safety Precautions
Before we began the preliminaries, my group risk assessed the hazards which we could come across whilst conducting the experiment. We pointed out that you could slice yourself when using the knife to cut the potato chips into cubes, and that you could be affected by food poisoning if your fingers went anywhere near your mouth.
The solutions to these were simple. When using the knife, we took extra care to keep it away from our fingers, and we washed our hands before and after handling the potatoes to prevent the spread of germs.
Method
Equipment needed:
Scalpel
Pen
3 Potato chips, raw
9 Test tubes
45ml Water (HO)
45ml Sucrose solution (1M)
Scientific Scales
Ruler
Pipette
Timer
3 Paper towels
- Firstly, use the scalpel to carefully cut the potato chips into nine cubes, each measuring roughly 1cm. Check the dimensions with the ruler, and note down each individual cube’s weight.
- Label the test tubes 0 (x3), 0.5 (x3), and 1 (x3). Using the pipette, measure three lots of ten millilitres out, and put them into the test tubes labelled ‘0’.
- Measure out three lots of 10ml of Sucrose solution, and put these into the three test tubes marked ‘1’.
- Then, take three lots of 5ml of the water, and put them into the last remaining test tubes. Repeat, but with Sucrose, to make the overall amount of liquid up to 10ml.
- Drop one potato cube into each tube, and start the timer when the last piece of potato is in its tube. Wait twenty minutes, then carefully tip away the excess liquid in each tube, but make sure that the potato is still intact.
- Write ‘0’ on one paper towel, ‘0.5’ on the next and ‘1’ on the last. Then, blot the potatoes on their respective towel, depending on what molarity they were soaked in. Weigh them again, and calculate the weight difference by using the formula:
Final Weight – Initial Weight = Weight Change
We can now estimate from this table roughly where our results should be about when we conduct our final experiment.
Final Method
We decided, for our final method, to increase the range of our results. Instead of using molarities of 0, 0.5 and 1, we chose to experiment with 0, 0.2, 0.4, 0.6, 0.8 and 1. Someone suggested leaving out the first and last, since we completed them in our preliminary experiment, however we repeated them in case of temperature change and other uncontrollable factors.
Results
The line on my graph gets less steep as the value of the X axis gets bigger. This is because the potato chip is becoming as flaccid as it possibly can, and so the change in mass of each molar concentration is becoming closer and closer together. From the line of best fit that has been added in, it can be seen that all of my points were close to creating a perfectly smooth curve. This shows that my results are fairly reliable. My graph fits in with my prediction.
Conclusion
I can conclude from my results that the higher the concentration of sucrose, the more weight lost from the potato; hence a higher rate of osmosis has occurred.
Evaluation
The experiment was successful in my opinion. I got a large quantity of accurate results from which I was able to create informative graphs. I think I took easily enough results for the amount of concentrations that I was using, and the time that I used for the experiment to last was enough to allow osmosis to happen. However, if I was to repeat the experiment I would create more concentrations if I repeated the experiment so that I would have more varied results, i.e. 0.1m, 0.2m, 0.3m, and so on.
The cutting of the potatoes was the most difficult part of the experiment. Although I was recording my results by weight, it could have affected the surface area and so the overall rate of osmosis. If I were to repeat the experiment I would have found a way to make sure all of the chips were the same dimensions, like by using a cutter. As well as the potato, I could have found a more accurate way to measure out the solutions and to determine the molar concentrations, like by using a burette. This would ensure that I have an accurate amount of solution in each test tube. I could also weigh each chip on a more accurate scale, e.g. not to 0.00g but to 0.000g.
There were not any out of the ordinary results, but some were not as close to the line as others. This may have been caused by human error. When the potato chips were removed from the test tubes and dried I may well have dried some potatoes more than others and so some would have more excess water, which would add to the mass. If the experiment was repeated I could find another way to dry the potatoes that would ensure that all were dried in the same way for the same accuracy.