How does the Activation Enthalpy and the Rate of Reaction vary with the Concentration of Reactants, Catalysts, and the Presence of Different Catalysts?
How does the Activation Enthalpy and the Rate of Reaction vary with the Concentration of Reactants, Catalysts, and the Presence of Different Catalysts?
Aim
To use the iodine clock experiment to test the benefit of some of the transitional metal catalysts and to explain how they work.
The iodine-clock reaction.
In this the oxidation of iodide ions to iodine molecules occurs, which are soluble in water and will show up as a pale brown colour. However, if starch is added to the reaction mixture the colour change is to a dark-blue colour, this is because the starch molecules form a complex with iodine. The reaction can be represented by the following half-equation:
Equation 1 2 I-(aq) I2 (aq) + 2 e- E /V = +0.54
There is a range of oxidation agents available to carry out this reaction. In fact, almost all transition metal ions may possibly be used to oxidise iodide ions. A look through the table of electrode potentials will give a list of possible oxidation agents. However, in order to study the catalytic properties of the transition metal ions, another type of oxidation agent had to be chosen. The standard iodine-clock experiment uses the reduction of the peroxy-disulphate ions. The half-equation of this reaction is:
Equation 2 2 e- + S2O82-(aq) 2 SO42-(aq) E /V = +2.01
Therefore, the overall equation of the reaction is:
Equation 3 2 I-(aq) + S2O82-(aq) I2 (aq) + 2 SO42-(aq)
As we are using Potassium Salts of both anions, the equation with the spectator ions (K+) would be:
Equation 4 2 KI(aq) + K2S2O8(aq) I2 (aq) + 2 K2SO4(aq)
This reaction involves two anions having adequate energy to overcome the repulsive forces between them and colliding in the right fashion. This occurs without a catalyst, but the speed at which this happens can be significantly increased with the addition of a transitional metal catalyst.
Rates of Reaction
The rate of reaction of most reactions is affected by temperature. An increase of temperature by 10 degrees centigrade usually results in a doubling of the reaction rate. The reaction rate depends on many factors, manly the rate of molecular collisions. The rates of molecular collisions depend on the energy that the molecule possesses; the concentration of molecules and the temperature both affect this. This rate of molecular collisions is represented by in the Arrhenius Equation. Viewed below:
k = A exp( -EA / RT )
k = rate constant
EA = activation enthalpy
R = ideal gas constant
A = frequency factor
The frequency factor is a quantitative representation of the orientation of the particles when they collide. The particles must collide in the right orientation and at the right position, especially with larger molecules - no reaction will take place. This frequency factor on the whole greatly reduce the rate of reaction, and with smaller particles it will still reduce the rate but not by such a large amount.
The Reaction Mechanism
The rate of reaction calculated using the above reaction refers to the rate of one particular step of a reaction. If the reaction only involves one step, then of course that is equal to the actual rate of reaction. For instance, the initial rate of reaction between hydrochloric acid and calcium can be calculated using the above method quite satisfactorily. But with more complex reactions the reaction mechanism comes into play, especially in organic reactions, because the reaction involves several steps.
Presume the rate of step one with respect to the concentration of chemical A in a particular reaction is of first order, but with respect to chemical A the rate of step two is of zero order, the overall rate with respect to chemical A will still be of zero order. This is because the intermediate formed can only be processed at a certain fixed rate. Any excess intermediate will remain in the intermediate stage until it can be processed in stage two; hence it is of zero order with respect to chemical A. When predicting the overall rate of reaction, always take the lowest order with respect to the concentration of a particular chemical and the slowest rate from of all steps of the reaction. This is called the 'rate-determining step'.
The Activation Enthalpy
This is the energy needed to break the required bonds at the start of the reaction to enable the reaction to progress. At a particular temperature the energies of each individual molecules are distributed according to the Boltzmann's distribution, where if you plotted number of molecules against energy, there will be a peak representing the average energy of the molecules but also molecules with either more or less energy on either side: There would then, theoretically, be a finite number of molecules with more than the activation energy at any given temperature and hence the reaction should occur at any temperature. However, most of the time in reality, it is either too slow to be measurable, or a necessary chain-reaction cannot start because of the low rate of the initiating reaction.
To calculate the Activation Enthalpy of a particular reaction, we need to use the Arrhenius Equation mentioned earlier. We are able to relate it to a graph by rearranging the 'k = A exp( -EA/RT )' equation into a 'y = mx + c' form; k represents the 'rate constant' which at a given temperature equals to the rate of the reaction, which is directly proportional to 1/t, where in this case t is the amount of time taken for the reaction mixture to turn blue. If we plot 1/Temperature against log(1/Time) (log(1/Time) = -log(Time), the gradient of ...
This is a preview of the whole essay
To calculate the Activation Enthalpy of a particular reaction, we need to use the Arrhenius Equation mentioned earlier. We are able to relate it to a graph by rearranging the 'k = A exp( -EA/RT )' equation into a 'y = mx + c' form; k represents the 'rate constant' which at a given temperature equals to the rate of the reaction, which is directly proportional to 1/t, where in this case t is the amount of time taken for the reaction mixture to turn blue. If we plot 1/Temperature against log(1/Time) (log(1/Time) = -log(Time), the gradient of the graph will be equal to -EA/R. this means that by running a reaction at several different temperatures we can calculate the activation enthalpy of the reaction and plotting a graph. The iodine clock experiment is slightly exothermic, but the effect of this very slight temperature rise is negligible.
Catalysts
The activation enthalpy is lowered when the catalyst is added. This is because the key bonds are weakened, therefore the energy needed to break them is substantially decreased. Heterogeneous catalysts provide a surface on which the reactants are adsorbed (this is where the reactants are kept on the surface of the catalyst) this increases the likely hood of a correct collision occurring because the atoms/ molecules that have been broken down from the original molecule are held on the surface whilst the other molecules approach. Most solid catalysts work by providing a surface on which the reactants can react, and other transition mental catalysts work by providing an easier mechanism for the reaction using the catalyst's transition properties.
Transition metal catalysts
Transition metals often catalyse redox reactions because they have a range of oxidisation states and can act as a temporary warehouse for electrons. The overall activation enthalpy of a catalysed reaction is lower than that of the original uncatalysed reaction. The most probable reason for this is that the uncatalysed reaction takes place between two ions of the same charge (both negative), but in the catalyst reaction both steps involve the reactions between pairs of oppositely charged ions.
A prediction can be made of if the catalyst will work like so: if the higher state of the catalyst will oxidise the substrate and the lower state of the catalyst can be reduced by the product then there is a possibility that the catalyst may work. However, if it will actually work or not cannot be predicted at this stage, and must be found out by experiment.
In this particular instance, the metal catalyst works by utilising its transition properties to cause chain-reactions, which is much faster than the original reaction. In the following example iron (II) ions (Fe2+) is used as an example, but the same principle can be applied to all transition metal catalysts used in this reaction. The equation for the first step of the catalysed reaction is as follows:
Equation 5 2 Fe2+(aq) + S2O82-(aq) 2 Fe3+ (aq) + 2 SO42-(aq)
The iron (II) ion is first of all oxidised by persulphate to an iron (III) ion. The iron (III) ion is then oxidises the iodide ion to iodine (which marks the end of this particular reaction), and, obviously, in the process is itself reduced back to iron (II), viewed below:
Equation 6 2 I-(aq) + 2 Fe3+(aq) I2 (aq) + 2 Fe2+(aq)
As both steps involve the collision between a cation and an anion, due to the natural electromagnetic attraction between the two, it happens much often than the single collision between the two anions in an uncatalysed reaction, thus greatly increasing the frequency factor in the Arrhenius equation. However, it should do little to alter the activation enthalpy as this is an ionic reaction and there is no breakage of strong covalent bonds involved.
If Cu2+ ions where to be used as a catalyst the reaction would be far quicker as the iodine would be produced in the first step and the Cu+ would be oxidised back to Cu2+ in the second step.
The catalyst chosen must have a redox potential between the two half-reactions to allow itself to be reduced by iodide and then oxidised by persulphate. By inspecting a redox potential table, I have identified several potential catalysts:
I have decided to try several other catalysts to confirm that they would not display catalytic properties in this reaction. The catalysts identified here are only the ones that could work, whether it actually works or not has to do with the entropy of its other state as well. For example, solid silver metal has a much lower entropy than its ionic counterparts, and therefore silver ions may not act as a catalyst in this reaction as it would require silver in the solid state be produced in an intermittent stage of the reaction. As systems naturally go towards the side with higher entropy the silver should not allow itself be reduced by iodide ions.
Initial rate of reaction
In most reactions the rate or reaction changes as the reaction progresses. The initial rate of reaction is the most important stage. By adding Sodium Thiosulphate the initial rate of reaction can be prolonged and therefore easily measured. The equation for this side-reaction is as follows:
Equation 7 I2(aq) + 2 Na2S2O3(aq) 2 Na+I- (aq) + Na2S4O6(aq)
The iodine molecules are turned back to iodide ions by the Sodium Thiosulphate, this continues to occur until all the Sodium Thiosulphate has been used. This is when the reaction turns blue because iodine is produced and reacts with the starch. This enables us to measure the initial rate of reaction over a long period of time because the iodide ions do not decrease in concentration until the reaction is complete. This technique will only work if the reaction of Thiosulphate with iodine is much faster than the oxidation of iodide by the persulphate ions. This appears to be the case, and may go part of the way to explain why erratic readings are sometimes obtained in reactions with Copper ions as catalyst, because the catalyst is extremely efficient in this case, and this side-reaction may not be able to keep up with the rate at which iodine is being produced.
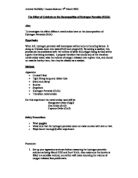
Risk Assessment
At 0.2M KI along with the other salts used, has a very low risk, however dilute salt solution precautions must be taken. These are: -
* The solution should not be ingested or injected.
* Spillages should be cleaned up with an adequate amount of water.
* Take extra precautions with salts such as Cupric Sulphate as contact with the skin could be harmful, however at 0.1M the risk associated with the use of such solutions is negligible, unless the is a prolonged contact with the skin.
* Mercury salts have a tendency to be poisonous, so a solution more concentrated than 0.002M should be labelled so.
The long-term effects of Mercury exposure: -
* Metal retardation
*
However the procedure I intend to carry out does not involve prolonged usage, and the small amount that I will be using can be washed a way down the sink with an ample amount of water when I am finished with it, or if a leakage or spillage should occur.
K2S2O8 is an irritant in its solid state so this represents a health hazard. This indicates than when making up my standard solution gloves and eye protection should be worn at all times as this should help to prevent any likely body contact. If a spillage should occur, like all of the above plenty of water should be used to clean it up. In the cases of where water cannot be used due to a hazard (i.e. the electronic balance) use a vacuum cleaner and then wipe thoroughly with a damp clothe to clean.
At 0.1M Silver Nitrate is an irritant and will stain clothes. Protective clothes should therefore be worn along with a lab coat.
NB. None of the above chemicals should be ingested. If gloves are not used for the dilute solution, hands should be washed thoroughly with soap and warm water at the end of the practical session in order to minimise the risk of ingestion after the lab session.
Apparatus
* Beakers (50ml & 100ml)
* Conical flasks (125ml)
* Stop clock
* 3-figure balance
* Standard bottles (250ml)
* Water bath (Room temp-70oC)
* Syringes (5ml)
* Weighing bottle
* Pipettes
Materials
* Starch Suspension
* Potassium Peroxydisulphate (K2S2O8(s)) Powder (100g)
* Potassium Iodide (KI(aq)) at 0.2M (1 litre)
* Sodium Thiosulphate (Na2S2O3(aq)) at 0.01M (500 ml)
* Mercuric Chloride Solution (HgCl2(aq)) at 0.1M (100 ml)
* Cobalt Sulphate (CoSO4(aq)) Solution at 0.1M (100 ml)
* Iron Sulphate Solution (FeSO4(aq)) at 0.1M (100 ml)
* Stannous Sulphate Solution (SnSO4(aq)) at 0.1M (100 ml)
* Copper Sulphate Solution (CuSO4(aq)) at 0.1M (100 ml)
* Silver Nitrate Solution (AgNO3 (aq)) at 0.1M (100 ml)
Method
Preparation of standard solutions
All solutions had to be made up in the lab. The weigh-by-difference method was used when making up the solutions so that the exact concentration could be established. The weigh-by-difference method involves: -
* First you need to work out how much mass of the solid powder you need. (E.g. 166g of KI is needed to make 1L of 1M solution, therefore 16.6g is needed to make 1L of 0.1M solution, therefore 33.2g is needed to make 1L of the 0.2M solution.)
* Using the 3-place balance, place as close to the correct amount of powder in a weighing bottle as you can.
* Note the value that the balance is showing and empty the contents of the weighing bottle into a standard bottle.
* Place the weighing bottle back on the balance and note down the change in mass. (i.e. the exact mass that has been transferred into the standard bottle)
* Calculate the molar concentration.
The starch solution should be made up at least every 3 days otherwise it will become unsuitable for indicator purposes.
The Potassium Iodide will 'go off' if left for too long in the presence of air, this is shown by the brown colour of iodine displayed by KI solution. This is because the iodide ions, which the solution contains, will spontaneously oxidise to iodine in the presence of oxygen. The solution should be made up fresh again when the colour becomes visible to the human eye; in order to prevent changes in the concentrations time goes on.
Practical Considerations:
Starting the timing
It takes less than one second to realise the Potassium Peroxydisulphate solution into the reaction mixture and so it think the start of the timing should be as soon as the Potassium Peroxydisulphate solution has started to leave the pipette. Even if one drop gets into the reaction mixture the reaction would have started, so in practise I must release as quickly as I can and the one second it takes would be part of the systemic errors present in the set of data obtained.
Results
Results obtained by changing the concentration of various chemicals
In all of the experiments 1/time is a measure of the rate of the reaction, and the volume reactants used is proportional to the relative concentration of the ions in the solution. By plotting graphs of ln(time), against ln(volume), the gradient of the curve is the order of reaction. This is derived as follows:
The rate obeys the following 'rate law' at a fixed temperature:
Rate = kCa (from the Arrhenius Equation)
ln both sides: ln(Rate) = ln(kCa)
ln(Rate) = ln( Ca) + ln(k)
ln(Rate) = a ln(C) + ln(k)
( y = m x + c )
ln(Rate) ~ ln(time)
ln(C) ~ ln(volume)
The results obtained when the volume of KI was changed
This shows that the order of reaction with respect to iodide ions is zero, possibly because there is an excess of iodide. It is evident from the 'average time' column in the results table that the average time was constantly around 139 seconds, meaning that a change in the concentration of KI would not speed up or slow down the reaction time. However, I believe that if a small enough concentration was used the reaction time would be longer. The reason this isn't shown in my results is because my volume did not reach a low enough value for the number of iodide ions to be small enough to have any time changing effects.
Results of changing the volume of peroxydisulphate
The table and graph gives good evidence of it obeying a law. I calculated the gradient to be 1.118. This could suggest a relationship of an order 1. However it is out side the 10% boundary (as 10% of 1 is 1.1) of an order of degree 1.
Results obtained by using the potential catalysts
Stannous ions failed to display any catalytic properties.
Mercury ions appear to be prohibiters of this particular experiment causing the reaction rate to substansiously drop, and, obviously, the time to increase (almost double).
Iron (II) ions at 0.1M concentration displayed significant catalytic activities, reducing the reaction time at least 35 times. So I extended my testing of the catalyst. I studied the effects of diluting the solution to 0.01M and 0.001M. Further diluting would have continued to find the point at which almost no change in the rate would have occurred if time had been permitting.
When Silver Nitrate and Copper Sulphate were added to the mixture of Starch, Na2S2O3 and KI solutions the effect was that it turned blue immediately. After further research I realised that the Silver Nitrate and Copper Sulphate solutions provided an alternate route for the iodide ions to change to iodine molecules without the need for the K2S2O8 solution. And so the research into their catalytic properties was abandoned.
Results of changing the temperature that the reaction took place
The graph on the next page clearly shows that an increase of temperature gives an increase in the reaction rate.
Specified and Possible Errors
Absolute Temperature Errors
The thermometers used in this particular experiment were standard laboratory thermometers. When checking their readings against each other it was found that they were quite accurate, giving temperature readings all within 0.5oC of each other. I found that the water bath which did not have a very accurate thermostatic dial. Often being at a different temperature from the dial. I had to use trial and error until the temperature stayed at the desired level, using a thermometer in each standard bottle of solution. The deviation of temperature within the beaker was around ±1.0oC, therefore the temperature is considered to be accurate to within ±1.0oC. In the temperature range 20 ± 1.0oC to 80 ± 1.0oC the errors in 1/Absolute Temperature is between ±0.000008 and ±0.000012 (0.25%). Given the scale of the graph, this error can be considered negligible, and its effect is likely to be swamped by errors produced in other measurements.
Errors when making up the solutions
A 3-figure balance was used to measure the amount of salt to be used in a standard flask. The 250 ml standard flask that was used had a specified error of ±1 ml at 20oC. The Standard bottle in which the solution was made up may contain impurities despite repeated rinsing with distilled water. The total quantifiable error in the concentration is 1% (resulting from the errors in mass (assuming a typical mass of 1.0g)) and 0.4% resulting from uncertainties in the volume, and therefore has a total possible error of 1.4%. As concentration remain the same throughout in most of the experiments, slight deviation from the standard concentrations is unlikely to affect the results.
Errors when using the pipettes to add solutions
The pipettes given were capable of measuring to within ±0.1 ml if stopped at the correct place, in line with the markings on the outside. However, in total 5 different solutions have to be placed within the test tube, which increases the specified error to ±0.5 ml. Some chemicals would not affect the results at all if they were to be over or under supplied by the pipette. The volume of KI, for example, because the reaction is of zero order with respect to the concentration of KI, and the abundance of iodide ions is not a limiting factor on the rate of reaction.
Errors in using the stopwatch
The human reaction time is about 0.5s. The average time for a run of catalysed experiment is around 20s, therefore the percentage error is 2.5%, and all the times should be treated as ±0.25s.
Conclusion
The catalysts
Cobalt Sulphate and Iron (II) Sulphate both work as catalysts, the second of the two being extremely effective. With Iron (II), even at 0.001M concentration the reaction rate had been increased
Mercuric Chloride, although a potential catalyst because of its range of oxidation states, is a prohibiter. It slows down the reaction. This could be because it could be forming a complex with the Iodide when it is first added, making it harder for the peroxydisulphate to oxidise the Iodide ions. The evidence that I base this on is that when the Mercuric Chloride is first added, a bright orange colour is revealed, and with shaking the solution returns clear. A change of colour in a solution is usually evidence of a complex being formed.
It was no surprise that the Tin ions did not catalyse the reaction.
Catalysts work usually by offering an alternative route for the reaction to take, often having an intermediate stage and so using more reaction steps, both steps with a lower activation enthalpy than the original un-catalysed reaction. The catalyst takes part in the reaction but is always returned back to its original state and oxidation number.
Orders of reactions
KI was found to be of zero order, but I believe that this is due to an excess of iodide ions, meaning that there is always more than enough iodide ions to use up all of the Thiosulphate. But I do believe that my experiments on the order of KI did not go down to a small enough value.
Peroxydisulphate was found to be of order 1.118. This unusual value is most likely due to inaccuracies in my method or in the equipment. Further research needs to be done as to what the value should be.
If something is of order zero then no mater what concentration is used the reaction rate will not change. Order one shows that if the concentration is doubled the reaction rate is doubled, if the concentration is halved the rate is halved. Another order is of order two, this means that if the concentration is doubled the rate is quadrupled, concentration halved the rate is quartered.
Temperature Changes
It is very obvious, and unsurprising, that the graph and table results show that an increase in temperature lowers the length of the reaction. As a general rule a rise of 10*C will double the reaction rate. This can be explained with the collision theory; the higher the temperature the faster the particles are moving, this means that they collide more often. Also each particle has more energy and so is more likely to over-come the activation enthalpy when it does collide. These two factors put together mean that a rise in temperature has significant effects on the rate.
Resources
Ted Lister and Janet Renshaw, Chemistry for A-level Third Edition. Pg369-378
G. F. Liptrot, J. J. Thompson and G. R. Walker, Modern Physical Chemistry. Pg443-452
Ann Lainchbury, John Stephens and Alec Thompson, ILPAC 9 second edition. Pg61-99 (chapters 9-11)
Nuffield Advanced Science, Chemistry, Students' book II, Topics 13 to 19. Pg121-153 (chapter 16)
Salters Advanced Chemistry 1994 data book. Table 19.
Hazcards.