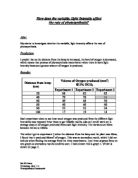
Graph 1:
To work out an average amount of oxygen produced at each intensity, I added the three values from each experiment and then divided it by three to find a average. Which I shown on the graph below.
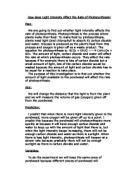
Graph 2
Analysis:
From the graphs, you can clearly see that there is a trend in the results. We can see that as the distance from the lamp increases there is a fall in the volume of oxygen produces. These results give me a firm conclusion to believe that the process of photosynthesis reacts better when there is more light intensity because then there is a rise in the amount of oxygen produced.
You can see the curve on graph 2 is arising. There are two sections on the graph, which I have closely looked at. The first in between the distance 20cm and 40cm, this is where the line is steady and also when the greatest amount of oxygen is produced. This line does not increase any more because of limiting factors.
The word equation for photosynthesis is:
Light
Carbon dioxide (6CO2 ) + water (6H2O) Glucose (C6H12O6) + Oxygen (O2)
Chlorophyll
This is when you need carbon dioxide, water, light and chlorophyll for the process photosynthesis to take place. So on graph 2, the line is straight because they may not be enough carbon dioxide or light, so this means the process is limited. In the experiment the HCO3 is the limiting factor. In the experiments I have taken, the concentration is at 3%, but if it were raised the oxygen produced would also be increased.
The next section of the curve is not proportional because the gradient of the curve changes towards the end. When the lamp is 100 cm away from the plant, the plant still produces oxygen even though there is not much light; there is still some energy to cause the process of photosynthesis. If there were no light at all, there would be no reaction because there is no energy source.
Overall, we can see from the graph, that the closer the plant is to a light source, the more oxygen is produced. I can make this firm conclusion because of the reliable results that I have obtained, which are shown in my results table and graph. The graph clearly shows the results and backs the theory regarding photosynthesis. The energy source, light, is the reactant, so I know when increasing the reactants, the products of the reaction increase as well.
Evaluation:
For this experiment, I did not do a practical. The three independent experiment results have been obtained from a computer program, (Focus CD), which efficiently records the data for which in this case, the distance between the lamp and the plant as a variable. I think the procedure used was not suitable enough to prove my prediction to be right because the results could be inaccurate, so for this reason I would have liked to have done the experiment practically. The following things are what I could have done to extend my investigation, I would have repeated the repeated the experiment a few times to get rid of anomalous results. Conducted the experiment in another room so there is no background light. All my measurements were accurate, except one anomalous result. It did not fit in as well as the other results. This result was in the third experiment, when the distance between the lamp and the plant was 40 cm. The first two experiment conducted were similar, the results were 79mm3 and 76mm3. The third experiment produced 88mm3 of oxygen. When working out the average oxygen produced at that distance, I excluded the anomalous result.
Ms Williams
Pavandeep Johal 11z