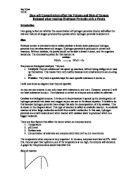
It is also important to note that although the enzyme obviously joins with the substrate for a short while, the enzyme and substrate split apart afterwards, releasing the enzyme. Thus the enzyme is not used up in the process (unlike the substrate(s)), so it can continue to react if more substrate is provided. This is demonstrated in the diagram below:
In my background knowledge I discussed enzymes, its jobs and properties as well as the affect of substrate concentration which have helped me in concluding a credible prediction.
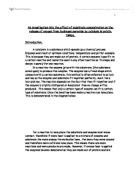
PREDICTION: I predict that as I increase the substrate concentration, the volume of oxygen collected will increase hence the rate of reaction will also increase.
A graph of my predicted result can be found below:
The graph shows that as the concentration of hydrogen peroxide substrate (x) is increased the volume of oxygen collected (y) will also increase.
PRELIMINARY WORK:
In order to ensure a fair test is carried out and the variables are used to their potential in order to conduct an accurate experiment, I will need to carry out preliminary work. This will consist of: experimentation of substrate concentration and size of potato pieces.
To produce reliable results I will need to ensure that only one of the variables is changed at a time and each recording is repeated twice. From this I should be able to calculate an average which will help me in choosing a reasonable criterion for each variable.
Preliminary work will also allow me to identity any arising problems at an early stage and determine the required apparatus needed to complete the experiment.
Results:
Varying substrate concentration
Length of potato chips – 5cm
Agreeing with my prediction the set of results show that as the concentration of hydrogen peroxide was increased the volume of oxygen collected also increased.
Varying potato size
Volume of water - 10cm3
Concentration of hydrogen peroxide - 40cm3
As the length of the potato chips was increased the volume of oxygen collected also increased. This shows that the length of the potato pieces has an influence to the rate of reaction; therefore this has to be kept constant.
No striking problems arose whilst conducting the preliminary work.
The outcome of the findings of my preliminary results, in accordance to the actual experiment can be found below:
Dependant variable – Volume of oxygen collected in a period of 5 minutes
Value = Centimetre cubed (CM3) 2 recordings for each varying concentration
Measurement method = Measuring cylinder
Independent variable – Concentration of hydrogen peroxide
Value = Centimetre cubed (CM3) 0-50
Measurement method = Measuring cylinder
Control variable 1 – Length of potato chip
Value = Centimetre (cm) - 3
Measurement method = Ruler
Control variable 2 – Temperature
Value = Degrees Celsius (ºc) Room temp. 22
METHOD:
The following apparatus will be needed to carry out the experiment:
- Beaker
- Conical Flask
- Cork and pipe
- Cork Borer
- 2x Measuring cylinders
- Water
- Hydrogen peroxide
- Pipette
- Potato(es)
- Ruler
- Knife
- Stop watch
- Tile
- Safety goggles
Below is a diagram showing the required set-up of apparatus:
The following steps will need to be carried out in order to conduct an accurate and more importantly successful experiment:
- Begin by setting out the apparatus as shown in the diagram above.
i: Ensure all the apparatus is setup on a clean and flat surface on the desk,
ii: and water is widely filled in the measuring cylinder placed in the beaker. Measure and make a note of the volume of this water attentively.
- Using the cork borer pierce potato pieces from the whole and using the ruler and knife individually cut the pieces to the required length of 3cm.
-
Knowing the first range of substrate concentration to be experimented is 50cm3, measure this in the alternative measuring cylinder and pour the contents into the conical flask.
- Drop a cut-out potato piece (3cm in length) into the conical flask and subsequently tighten the cork onto the end of the test tube.
- Ensuring the cork is firmly attached to the test tube start the stop-watch timer.
- Once 5 minutes is reached on the timer remove the pipe from the measuring cylinder and cautiously measure and note the volume of water in the measuring cylinder.
- Repeat stages 3-6 again, but stage 3 should be altered so the next range of substrate concentration is experimented.
i: this procedure should continue until you have recorded all results up to 50 cm3 water and 0 cm3 hydrogen peroxide.
- Finally repeat the whole experiment again in order to increase the accuracy of results which will make an average calculation possible for each recording.
Before the results are recorded into the final results table, initially this should be converted to the volume of oxygen collected. This can be calculated from simply subtracting the volume of water present in the measuring cylinder after 5 minutes from the volume of water at the beginning of the experiment.
There are many elements to ensure a fair test is carried out: All recordings will be repeated twice; this will allow me to identify any recording that doesn’t follow the usual trend and furthermore calculate an average, I will use the same set of equipment for each recording, and caution will need to be taken when measuring the volume, as a mere mismatch of measurement may be unreliable.
Safety is also a major factor that needs to be kept in mind at all times:
All apparatus should be handled with care, and primarily with the glass equipment placed away from the edge of the desk.
RESULTS:
Length of potato chips – 3cm
Temperature – Room temperature
The lengths of the magnesium were all matching in length, and I assured the concentration of hydrogen peroxide used was as precise as possible to the required measurement.
As can be seen, each recording was repeated twice. This was to ensure the most accurate results were produced and with two sets of recordings this would allow me to calculate an average.
ANALYSIS:
Now that I have completed the practical experiment and results have been recorded, I am able to analyse the results and come to a conclusion in contrast with my set prediction
I will begin by plotting a scatter diagram showing all the results for the volume of oxygen collected against varying substrate concentration. This will allow me to observe the accuracy of results and also, through a visual display, identify any possible recordings that don’t follow the usual trend.
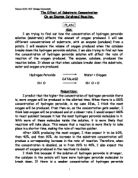
The concentration of hydrogen peroxide as a percentage is a lot more convenient and manageable. This has been tabulated below:
Refer to diagram 1.
The scatter diagram suggests that the relationship between the volume of oxygen collected and concentration of hydrogen peroxide is not continuous. Therefore I have drawn a curve of best fit which embraces all the points. From this it is noticeable that the curve forms a relationship that y increases at a decreasing rate meaning the volume of oxygen collected does increase as the percentage concentration of hydrogen peroxide is increased.
I will now produce a line graph showing the relationship between the % concentration of hydrogen peroxide and the average volume of oxygen collected. This will allow me to observe the overall trend / relationship in more detail and furthermore enlighten my set prediction.
Refer to diagram 2.
The same relationship is formed again showing that the volume of oxygen collected increases as the concentration of hydrogen peroxide is increased. This agrees with my set prediction, but to test whether my prediction graph is correct I will now have to observe the relationship for the rate of reaction against % concentration of hydrogen peroxide.
The rate of reaction is simply how much oxygen is collected every minute; therefore this can be calculated from simply dividing the average by the number of minutes taken (5). The results are tabulated below:
Refer to diagram 3.
Again the line graph shows the same relationship as the others: y increases at a decreasing rate meaning that as the concentration of hydrogen peroxide was increased the volume of oxygen collected also increased. This proves that my set prediction and graph are correct.
Overall from the analysis I have proved:
- As the concentration of hydrogen peroxide is increased the volume of oxygen produced also increases
- As the concentration of hydrogen peroxide is increased the rate of reaction also increases which validates my prediction is correct.
Background knowledge reasoning:
The volume of oxygen collected increases as the concentration of hydrogen peroxide is increased as according to the collision theory. It states that when two substances are mixed together, the chances of the more important molecules colliding are increased as the concentration of a substance is increased.
As can be seen, all three graphs seems to level off towards the end. The reason for this is because there becomes a point when the active sites on the catalyse become entirely engaged, which means that despite adding more hydrogen peroxide, the level of oxygen would remain the same. This can be backed up by the lock and key theory. The theory states the enzyme breaks down the substrate. The active site of an enzyme (the lock) has a specific shape in which only the precise amount of substrate (the key) will fit, thus forming an enzyme-substrate complex. Hence the graphs curve of best fit would plateau out like it appears to be doing in all 3 graphs.
EVALUATION:
As can be seen from the circled point on the majority of graphs produced from the results taken, this is identified as an anomaly as it disperses away from the usual trend of the graph. There are many reasons to indicate why an anomaly is present; this consists of human errors and equipment restrictions and possible unruly scientific theories that affect the whole experiment.
- The method of using a stop watch to measure the time of reaction was not as reliable as to using more precise recording apparatus such as a time measuring and indicating device for example. This is 1) due to the unit of time where all recordings were automatically rounded to 2d.p. and 2) the mature condition of the stop watch used at times caused a lockage in the start and stop buttons.
- Again another profound error may have been the concentration of hydrogen peroxide. I ensured as much solution as possible was poured into the required conical flask after being measured in the measuring cylinder, however there were always small drips of liquid that were inevitable. It is illegible whether this has an influential affect; however this regardless opposes the accuracy of the recordings.
- The potato piece was changed for every result, therefore it is likely that there was a different amount of catalyse in each piece.
Furthermore it was very difficult to make sure the potato pieces were of exact matching properties. I ensured they were all corresponding in length, however the widths were all different and some had small blotches.
In addition when the potato pieces were cut to the required size, the inside was exposed to air. This may have affected the catalyse.
- The timer wasn’t started the moment the actual reaction commenced. When the potato piece was dropped into the conical flask, I first had to attach the cork to the end of it before I started the stop watch. Therefore the distinction of starting the timer to when the reaction had actually begun may have affected the accuracy of a recording.
- Temperature was a constant variable however it is possible that the temperature may have changed during a reaction. This is mainly due to the reason that hydrogen peroxide has an exothermic reaction, meaning that heat is given out to the surroundings. Therefore temperature may have affected the overall results.
There are also reasons to compliment the accuracy of my results:
- Each recording was repeated twice. This enabled me to calculate an average and gave me the advantage of being able to produce a better analysis overall.
In addition to the scopes of errors mentioned above, there are many other incontrollable factors that may have had a form of influence or obstruction. However no significant problems or difficulties were encountered whilst conducting the experiment.
My results and conclusion were accurate and reliable enough to verify a relationship that as the concentration of hydrogen peroxide is increased, the rate of reaction also increases, hence agreeing with my set prediction.
Improvements:
No matter how accurate produced results are, due to the restriction in apparatus provided and the time to complete the investigation, improvements will always be applicable. Possible improvements:
- There are methods to ensure the temperature is kept constant throughout the experiment. This could be by adding ice whenever the temperature exceeds the normal room temperature; however it is known that the most productive temperature for enzymes to work is at about 40°C. So therefore the temperature could be kept at this constant with the use of a thermometer, Bunsen burner or kettle.
- Instead of simply measuring the length of the potato pieces it would be more accurate if they were weighed also. This would be to ensure the pieces are indistinguishable.
- Even though two repeats for each recording was accurate enough to produce a reliable average, increasing this to three or four recordings would produce a range of results which could then be analysed in more detail.
Extending the investigation:
- There are alternatives to using a potato for catalyse for example cheese or bread. A liquid can also be used, yoghurt, beer or wine to name a few examples.
-
It would be interesting to observe the results if the concentration of hydrogen peroxide was varied to every 5cm3.
- The affect temperature has on the rate of reaction can be investigated by making this the independent variable and making the concentration a constant.
SECONDARY SOURCES OF INFORMATION:
http://
http://homepage.ntlworld.com/mbradley49/science/amylase_project.html