Catalase:
Catalase is an enzyme found in all living organisms. It speeds up the decomposition of hydrogen peroxide from metabolic processes (a harmful by product).
Here is the formula:
2 H2O2 → 2 H2O + O2
We now had our experiment; we wanted to study the effect of changing the concentration of the enzyme catalase to see how it affected the amount of oxygen produced.
DATA:
We had to decide on what data we were going to collect in our experiment.
5 different percentages of enzyme concentration – we chose this because it’s sufficient data to produce a good graph from and interpret the trend and correlation.
We chose to do 3-5 repeats depending on the amount of time we had. This would allow us to get a fairly good idea of there might be any anomalous results. It would also provide a meaningful average. We can also tell the reliability of the experiment by looking at the spread of the range bars. The larger the range bar the less reliable.
PREDICTION:
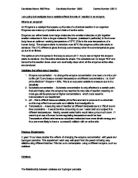
As you increase the enzyme concentration you increase the number of active sites. As there are more active sites, there is a greater chance of a collision occurring between a substrate molecule and the active site. Therefore the rate of reaction will increase enzyme concentration. In fact it should be a linear correlation.
Dilution Table:
Using 50g of celery broken up in 100cm³ of buffer at pH 7 as the standard 100% enzyme concentration. This was then diluted with more buffer to produce a series of enzyme concentrations:
COLLECTING DATA:
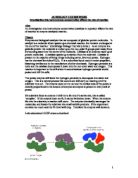
Method:
- Set up all apparatus (check equipment diagram)
-
Fill bowl with water, take a 50cm³ (±0.5cm³) measuring tube and fill it with water and invert it so as to not have any bubbles.
- Take a conical flask and ready it with a bung and tube (the tube will be placed under the measuring cylinder underwater.
- Mix the catalase and pH buffer together to get the correct mix (20%, 40% etc)
- Put 7cm³ of hydrogen peroxide into the conical flask using a 5cm³ Syringe (±0.1cm³)
- Put the catalase/pH buffer mixture into the conical flask and shake, as soon as you have started shaking start the timer.
- After 20 seconds remove the tube from under the measuring cylinder and mark down the result.
To keep as many variables constant as possible take care to:
- Keep water from entering the delivery tube
- Shake the flask at a constant rate
- Start the timer at the same time as the person starts shaking
- Stop the timer as soon as it reaches 20 seconds whilst the other person removes the delivery tube quickly and carefully
- Avoid pulling the measuring cylinder up too high so that it comes out of the water thus letting more air in.
Safety:
Hydrogen Peroxide is an oxidising agent – it can oxidise organic matter, e.g. fibres in clothes. Protective lab jackets will be worn and safety glasses to prevent chemical burns to the eyes. We will also make sure that the flask of hydrogen peroxide is somewhere where it will not get knocked off the table.
Measurements:
To collect reliable/precise/accurate measurements certain principles must be adhered to.
- When shaking the flask try to be consistent throughout the experiment to minimise variation in shaking.
- Try to keep the delivery tube free of water and keep the same amount of tube underwater each time you take a measurement to prevent more/less oxygen coming through due to water
- Use pH buffer to keep the pH the same throughout the experiment.
Control Variables:
Temperature will be monitored at all times using a thermometer. It did was seen not to vary during the course of the experiment so no further control was needed. pH was controlled by a buffer at pH7. Substrate was always the same volume and in excess
Preliminary Data:
We had to decide on the ratio of enzyme/pH buffer:Hydrogen peroxide. Our preliminary data showed us that 5:7 worked best because the time taken for the catalase to react with the hydrogen peroxide started to slow down just after 20 seconds, this also gave us the time which we would collect the oxygen for.
Here the table shows us that using 5:7 gives us nearly 60 cm³ in 30 seconds, undocumented here but when we were taking the preliminary data we found that in 20 seconds that with this ratio we got very good and reliable results in 20 seconds this is why we chose to use this period of time and ratio.
Results:
I took each set of the data I collected from the experiment (set 1, 2 etc and the mean of all the sets) and made a graph for each one setting the intercept at 0,0 (as we know that when there is no enzyme there will not be any decomposition of hydrogen peroxide) and used a linear trend line.
Set 1: y = 0.4918x
Set 2: y = 0.5027x
Set 3: y = 0.5118x
Mean: y = 0.4982x
Hand drawn graph using mean: y = 0.5102x
I would say that Test 1 has the least errors in it. The plotted data is very close to the trend line which should mean that the data is fairly accurate - assuming the trend line is accurate. All the plots touch the line of best fit. However the data from Test 2 and 3 is a bit more varied. The mean seems quite precise as nearly all the lines are touching each other. All the graph’s equation are very similar with only a range of 0.02 x X; I would say the experiment was fairly reliable from this perspective. However upon looking at the error bars on the hand drawn graph we can see that the results are a little erratic. At 20% a huge error bar with the mean dead on the line indicating the results are not very precise. At 40% we see a very small error bar with the mean in the middle, the error bars do not even touch the trend line however it is fairly close. 60% shows us a large error bar which ¾ is above the trend line with the mean a little above the trend line, a possible anomaly is here. The last bar (100%) is very small (error bar-wise) and the mean is right at the top which would appear to show an anomaly but upon examining the results there is only a 1cm³ difference. The hand drawn graph’s equation is 0.49x which means for every 1%increase in enzyme concentration there is a 0.49 cm³ increase in the volume of 0₂ produced/20 seconds.
To conclude on the reliability, precision and accuracy of the results I would have to say:
- The line equations appear very similar
- However when looking at the error bars there is quite a spread of data
- 2 error bars do not even touch the trendline indicating anomolous results.
The rate of reaction increases with concentration of enzyme because:
- As the catalase’s job is to breakdown hydrogen peroxide, the more enzyme the quicker the rate of which the hydrogen peroxide is broken down.
- The more enzyme there is i.e. the higher the enzyme concentration then there will be more active sites then it is more liekely that a hydrogen peroxide molecule will collide with an active site and hence there will be more successful collisions. So if there is twice as much enzyme than there will be wice as many active sites and the rate of reaction will double
EVALUATION:
In retrospect I believe the way in which we carried out the experiment with the available equipment was quite intelligent however with more time we could of made it a bit more sophisticated to improve reliability such as:
- The delivery tube filling up with water. To remedy this problem we could have set up the delivery tube to always be at the same depth in the water so that the same amount of water entered the delivery tube alternatively we could have added a one way valve to the end so that water didnt enter the tube – this would improve reliability by stopping water getting in, this caused problems because with lower concentrations not enough pressure was built up hence the rather variable results we collected.
- Shaking should be automated some how – perhaps a low geared motor with a cam on it (an off center hole) this would improve reliability.
Of course all of these are not exactly ideal choices – these are just suggestions to improve the experiment in the classroom. If more sophisticated equipment was available, a shaking stand for the flask would be good, also a one way valve for the test tube and reliable pH buffers would make the experiment far more accurate, reliable and precise. Timing should be controlled somehow such as when when the enzyme is added to the hydrogen peroxide a timer should be triggered and after 20 seconds take a reading and shut off.
A gas syringe would be a very accurate way of measuring and would be the best way to carry out the experiment.
Anomalous results:
Test 3 had a result 5cm³ difference from the other recordings, I believe this to be anomolous and due to a large amount of water in the delivery tube.
At 20% concentration the results were variable 7,10 and 13cm³ this is a mean of 10cm³ which may be accurate but not precise. I beieve this again was due to water in the delivery tube with the low pressures the gas output variaed a lot because each time the repeat was carried out there was a different amount of water in the delivery tube.
Conclusion:
I am confident in saying that the relationship between catalase and hydrogen peroxide shows a positive linear correlation. My data was reliable as shown by the very small spread in the range bars and accurate as all points are close to the line of best fit. I am also sure that by using a gas syringe the experiment would produce even more accurate results, but even this experiment has proved that increasing enzyme concentraion increases the rate of reactions.