To make this test fair I am going to use the same volume of solution in each beaker so that each cylinder has the same potential for osmosis. I am going to use the same species and if possible the same potatoes so that they start of with the same cell content. Different types of potatoes may have different concentrations of cell sap in their vacuole, which could make the concentration gradient steeper or less steep, which would then have an affect on the potential for osmosis and the amount of water that diffuses in or out of the cell. I am going to use the same size potato cylinders so that they all have the same surface area. If they had different surface areas this would affect the potential for osmosis. It one cylinder had a larger surface area it would have a higher potential for osmosis and therefore the results couldn’t be compared to that of another cylinder. I will leave them in the solution for the same amount of time because it is important to give them all the same amount of time for water to move in or out through the partially permeable membrane of the cell vacuole and cell. If one of the cylinders was immersed for longer it will have had more potential for osmosis and could therefore not be compared to the results of other cylinders.
To help ensure that my results are accurate I am using three cylinders for each solution so that I can eliminate any extreme values and take an average of the results in case there are any cylinders, which may be different to the others.
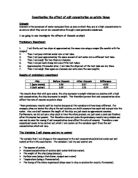
From my preliminary tests the length of the cylinders increased in 4% solutions so I can predict that the potato cylinders placed in the 4% solution will get lighter. This is because the concentration of water molecules is higher within the potato cell vacuole (it has a more dilute solution). Because the salt solution is more concentrated, water molecules will move out of the cell vacuole via the vacuole and cell membranes, which are partially permeable. This will leave the cell flaccid and lighter. Flaccid is when the cell becomes floppy and the cell membrane moves away from the cell wall. In my preliminary experiment the cylinders in 0% concentration got heavier so I can predict that the potato that is in the distilled water will become heavier. This is because the solution is more concentrated within the cell vacuole so water molecules will move into the cell via the partially permeable cell and vacuole membrane leaving the cells turgid and heavier. Turgid means that the cell is hard and stiff and the vacuole is full of liquid so the cell membrane is pushing against the cell wall. I can predict that the net movement of water molecules into the cell will progressively decrease in solutions above 0% concentration because the solution on the outside will have a higher concentration. This means that at some point between 0 and 4% there should be no net movement of water molecules as the concentration may be around the same as that in the cell vacuole. This means that the cylinder will stay roughly the same weight. After this point there will be a net movement of water molecules out of the cell vacuole which will increase up until 4% which is the highest concentration I am investigating.
Analysis
Overall, my graphs show me that when the potato tissue was placed in 0% concentration it gained mass and as it was placed in increasing solution concentrations the mass gain decreased and became a loss in mass after 1% salt solution. An increase in mass means that water molecules have passed into the cell vacuole through the partially permeable cell and vacuole membranes because the concentration of the solution inside the vacuole was more concentrated than that of the solution outside it. On the first graph and table, an increase of mass is as being bigger than 100% and on the second graph and table it is shown as being a positive mass change. A decrease in mass means that water molecules have passed out of the cell vacuole through the partially permeable cell and vacuole membrane because the concentration of the solution on the outside of the cell was higher than that in the vacuole. This is shown as being less than 100% on the first graph and table and being a negative mass change on the second graph and table. The line of best fit that I acquired on my graphs is not a straight line, which shows that the change in mass is not directly proportionate to the change in salt solution concentration.
My first graph shows the percentage change of original. My second graph shows the percentage change in mass. They show that when the potato tissue, which is made up of potato cells, was placed in distilled water, of a concentration 0%, the concentration inside the cell vacuole was higher than that of the distilled water. Water molecules moved through the partially permeable cell and vacuole membrane, into the cell vacuole resulting in an increase in mass. This supports my prediction, which was that potato tissue placed in 0% concentration would gain mass. In my experiment, this mass increase was on average 3.38% of the original mass. When the potato tissue was placed in 1% salt solution, the cylinder gained on average 0.47% that means that water molecules have moved into the cell vacuoles. This means that the concentration outside the cells was higher than that inside the cells but only very slightly. The concentration of solutes inside the cell vacuole lies somewhere between 1 and 2% concentration. This supports my prediction that at some point there should be no net movement. It lies much closer to 1% as the cylinders placed in 2% salt solution lost on average 2.36% of their mass which means that water molecules inside the cell vacuole moved out of the vacuole through the partially permeable cell and vacuole membranes. From my second graph, I can see that the concentration inside the cell vacuole is approximately 1.2% because this is the point where there is no mass change. The water molecules are moving in and out across the partially permeable membranes at the same rate, so there is no net movement in one direction. The potato tissue placed in 3% salt solution lost on average 10.94% of its mass and the potato tissue placed in the 4% salt solution lost on average 12.3% of its mass. This supports my prediction that potato tissue placed in 4% solution would lose mass. Potato tissue placed in 4% salt solution lost more mass than the others because the concentration gradient between the outside of the cell and the contents of the vacuole was the steepest in comparison to the other solutions.
The graphs are steepest between the 2% and 3% concentration, which means that the concentration gradient was much steeper at 3% and changed the most between these two points while not being limited by other factors. The graphs are “s” shaped curves, which means that the extreme concentrations have leveled off. This is due to the fact that there is a limit to the amount of water a cell can lose or gain. This is because the cell can only hold a certain amount of solution as the cell wall stops it holding any more otherwise it would burst. In addition, a cell can only lose as much water as it contains so after a point it cannot lose any more water. This means that the change in mass was not directly proportionate to the change in salt solution concentration and a straight line of best fit did not appear on the graph.
Evaluation
To get accurate results we took many measures including:
- Cutting the potato cylinders using razor blades and rulers.
- Using potato cylinders from the same potatoes so that the concentration of the solution within the cell vacuoles was very similar if not the same as the concentration within the other cells within the other cylinders.
- Drying the cylinders before weighing them before they had been in the solution and after they had been in the solution to get rid of excess liquid which was not a result of osmosis.
- Making sure that the potato cylinders did not touch each other as this would effect the surface area and any change in surface area effects the rate at which osmosis occurs.
- Timing the length of time the cylinders were immersed with a stop clock to ensure that none of the cylinders had longer than any of the others in which osmosis could occur.
-
Weighing the cylinders to 1/100th of a gram using a 2 decimal place balance.
Although we took all these measures to ensure our results were accurate there were many places where the reliability and accuracy of our results can be questioned because of our own errors or because we were not able to do it any other way in the time we had. These included:
- Cutting the potato cylinders ourselves by eye using the ruler. This meant that each cylinder could have varied slightly in length and even the slightest change in surface area affects the rate at which osmosis occurs.
- Although we tried to make sure that the potato cylinders did not touch, due to the size of the beakers this meant that one of the cylinders had to be stood on its end. This changes the surface area available over which osmosis could occur from the cylinders lying on their side. This could have effected the rate at which osmosis occurred for this cylinder.
- Although we timed the 20 minutes of immersion, the cylinders could not all be placed without touching each other into the solution at the same time. They could also not all be taken out at the same time. This means that some cylinders may have had longer for osmosis to occur than others which could have effected our results.
You can see the inaccuracy of our results by looking at the different range of percentage change for potato cylinders placed in the same solution. For example in 2% salt solution our first cylinder had a mass change of –1.87% and our third cylinder had a mass change of –2.78%. The error bars show this on my graphs. You can see that these results are quite far apart therefore they cannot be entirely accurate. Ways to improve the accuracy of out results include:
- Using a mechanical cutter or a more accurate cutting technique so that the surface area available to each cylinder for osmosis to occur would be equal.
- We could use bigger beakers or separate beakers so that each cylinder is in the same position and the same amount of surface area is touching the surface of the beaker making the areas equal over which osmosis can occur.
- If we used separate beakers we would be more able to put in and take out the cylinders at exactly the same time as well to ensure that they all get equal time during which osmosis can occur.
- We should use more potato cylinders so that extreme values do not effect the average as much or can be disregarded completely.
The lines of best fit on my graphs show a clear pattern of mass change that was the result of different concentrations of salt solutions. However, this is only an estimate of this pattern as the line of best fit has been drawn connecting only 5 points. This allows us to arrive at a basic conclusion that the cylinders that were placed in distilled water increased in mass due to water moving into the cells and the cylinders placed in concentrations above 1% lost mass due to water moving out of the cells. However, this is only a limited view, as we do not know what the change in mass is between the points marked on the graph. This means we do now know at what concentration the solution in the cell vacuole and the solution outside it were equal. In my experiment the change in mass was smallest at 1% and therefore is roughly the same concentration as the solution in the cell vacuole. For a more accurate result you would need to make improvements to the experiment. The reliability of the results would need to be improved. On the graphs you can see by the error bars that the results for 4% concentration were the most accurate because the bar is smallest. The results obtained at 3% solution however were very inaccurate and I think this definitely effected the reliability and the drawing of the line of best fit.
The reason the error bar is so big for 3% concentration is because of the result obtained for the third cylinder. It is an anomalous result, which is a result that is clearly different than the others in the group. The third cylinder in 3% had a percentage mass change of –13.88% whereas the other two had percentage changes of –9.52% and –9.43%. This is a difference of over –5%, which severely effected the average. This result could have been effected by any of the factors mentioned above, for example the cylinder could have been allowed to stay immersed longer than the others allowing more time for water to pass out of the cells by osmosis resulting in a loss of mass greater than the others.
To extend this experiment and achieve more accurate and reliable results you could take down a lot more results and repeat the experiment multiple times. You would do this so that anomalous results and extreme values would less effect the average. You could also disregard results that are extreme and anomalous to make it more reliable. Another way to extend it would be to carry out the experiment over a larger range e.g. 0.2%, 0.4%, 0.6%, 0.8%, 1.0%, 1.2% etc. This would allow you to more accurately find the concentration of solution at which no net movement of water occurs because the concentration inside and outside the vacuoles is the same. This would mean being able to more accurately know the concentration inside the vacuoles.