The outcome variable I will be measuring is the amount of oxygen produced by the aquatic plant known as pond weed. Oxygen is one of 2 products of the green-plant process photosynthesis, the other being glucose. I chose to measure the amount of oxygen produced over the amount of glucose, as in an aquatic plant, the oxygen produced is easily visible with the correct set-up of equipment. (See diagram a for set-up of equipment & figure a for list of equipment used)
I will measure the amount of oxygen produced by counting the number of bubbles of oxygen given off by the pond weed within a set time of 3 minutes. I could have measured the amount of oxygen given off by the pond weed another way though, by measuring the volume of oxygen present in test tube placed over the funnel covering the pond weed (See diagram b.) I opted against this procedure though, due to problems encountered in my preliminary investigation. Alternatively, I could have chosen to measure the other outcome variable, amount of glucose present. I could have done this by means of investigating the amount of starch present in the leaf of the plant (Glucose is converted promptly into starch by plants as it is insoluble, which makes it much better for storing within the leaf). This process though, would obviously be more difficult to measure than the outcome of oxygen. If I was to investigate starch present; I would have to do this by means of placing iodine onto the leaves of the plant and noting the colour of the staining upon the leaves. As I am working with pond weed, where the leaves are shaped a lot differently to that of a “normal” household plant, this would be a difficult outcome to measure accurately. And as both methods (finding starch/ measuring oxygen given off by the plant) show that photosynthesis is taking place, I chose to measure the rate of oxygen produced.
Diagram a:
Figure a: List of equipment required, and required measurements
-
Large beaker, or alternatively a 2 litre bottle cut in half: Fill with water at 30 degrees centigrade to 1 litre
-
One small lamp: to be connected via plug to an electrical socket
- A metre rule
- A 4 cm piece of pond weed
- Stop clock
-
A funnel: large enough to cover pond weed, yet small enough to fit inside the large beaker & be covered by the water within
Alternatively for the measuring volume of oxygen given off experiment
-
A test tube: Large enough to cover the spout of the funnel
Diagram b:
Preliminary Investigation & Results obtained
I also set other guidelines of the kinds above during my preliminary investigation, which would be the basis of my final experiment. e.g. range of distances of lamp from pond weed, how I would measure my outcome variable, the time limit I would set for measuring the outcome variable etc) My preliminary investigation & results, are as follows below.
As mentioned previously, my preliminary investigation helped set the guidelines for my actual investigation, yet initially it was to gain an idea of the range of distances at which I would set the lamp form the aquatic plant, to vary light intensity available. Before this aspect of the investigation, I had no idea of what the outcome variable results (rate of oxygen bubbles produced) would be, when the lamp was set at any distance. Similarly, I had no idea at what distance the plant would cease to photosynthesise, as the lamp was the only source of intense light available. The lab in which the experiment took place was not very well supplied with light, if the lamp was not present, it would not be wrong to say that photosynthesis would have ceased to take place within the lab at all. From this I have gained the knowledge that the original light within the lab (without the aid of the lamp) would not effect the investigation by very much, if at all. Though I still bared this point in mind..
I decided randomly, that the distances at which I would place the lamp to complete my preliminary procedure were going to be 0cm, 50cm & 100cm. I could then see that if the process would not give sufficient results with the lamp at a distance from the pond weed at 50cm, then process of photosynthesis would definitely cease to take place with the light source at a distance of 100cm from the pond weed. I also decided I would take the results of the outcome variable within a 5 minute time limit, and for this aspect of the investigation, I would not take repeat results. I also decided though, that I would count the number of bubbles, and that if there were a large amount, or they were at a large size, or that they were given off too rapidly to count, I would measure the volume of oxygen in my actual experiment. I set the equipment up as in diagram b.
The results of my preliminary procedure are as follows below.
It was from these results that I decided my smallest & greatest distances of the light source from the pond weed. Yet it was odd how the results were so similar, considering the distances were of 50cm apart. This contradicted my prediction, and it was from this I realized that there was a factor I had not discovered that was creating this odd pattern of results. I decided that I would have to set further limits to my investigation, not to gain such “odd” results again. These other “rules” I set to be carried out during my actual experiment, after the problems I encountered during the preliminary procedure. They are as follows overleaf.
1: Pond weed shall be left to adjust to new light intensity in between distances for 2 minutes. The reason for this is to gain a more reliable result of the outcome variable. (This factor was the main reason for the preliminary results being so similar)
2: The experiment should always take place in the same area of the lab as previous, the reason for this being that some areas of the lab are better lit than others.
3: Water in which pond weed is surrounded by should be approx 25 degrees centigrade at all times. Although this is slightly high for the temperature in which a plant generally photosynthesises best, (20 degrees centigrade) it was the first temperature at which the experiment worked successfully, and so we decided that it should be kept constantly at this in order to conduct a fair test.
4: We will measure the outcome variable by counting the number of oxygen bubbles the plant gives off. The reason for this being that the oxygen bubbles given off in the preliminary experiment were very small and not given off frequently enough in order to measure volume. Though we realize that this process would be more accurate in measuring the amount of oxygen given off by the pond weed.
5: The time in which I will measure the number of oxygen bubbles given off by the pond weed will be 3 minutes and not 5. The reason for this is that it would take a total of 10 minutes to gain the results of just one measurement if the time limit set for measuring the outcome variable was 5 minutes. This was a suitable amount of time for the preliminary procedure though, as we were not taking repeat measurements.
These new “rules” for the experiment, along with the original factors I decided to keep constant (the variables I will not change) will make my results more accurate and reliable.
Safety precautions
- Paper towels must be kept at aid at all times throughout the experiment, as we are working with water & if it is spilled and not cleared it is a slipping hazard to others who are unaware of the spillage.
- Make sure hands are completely dry when placing plug of lamp into the electrical socket, as an electric shock, however minor may occur.
- As I will be working with glass products (beakers etc) a breakage must be immediately reported. Likewise if a thermometer, which I will be taking the temperature of the water with, is broken this must also be reported immediately, as it contains poisonous mercury.
- Work generally in a safe & mature manner, and be aware of others who will also be conducting the experiment.
Plan of investigation
3 persons are needed to complete the investigation
-
Gather all of the equipment listed in figure a & complete set-up displayed in diagram a.
-
Nip end of weed with nail, it is where the O2 will be seen from.
- Set light source (lamp) at 0cm from pond weed in large beaker
- Leave pond weed to adjust to first light intensity of the light source for a timed 2 minutes
- Person 1 prepare stop-clock to time outcome variable results for 3 minutes
- Person 2 prepare to count number of oxygen bubbles given off within this time
- Person 3 prepare to note number of bubbles called out by person 2
- Begin what you have prepared to do after the “adjusting time” of 2 minutes
- Note the results you have gained
-
Repeat the test for 0cm once more, if results are a lot different, repeat a 2nd time
- Leave for 2 minutes to adjust to light source at 25cm away from pond weed
- Complete the above for light source at a distance of : 25cm, 50cm, 75cm & 100cm
NOTE: It is helpful to begin constructing a rough graph of the results you are obtaining throughout the experiment in order to see whether you are gaining accurate results. You should see this if a downward curve/line is present, if you are recording distance of the lamp from the plant, on your graph.
You should see an upward curve/line present, if you are recording light intensity on your graph, the reciprocal of the distance, other wise stated as 1
D
This is perhaps the best choice of graph to construct, as it clearly presents the idea that as the light intensity increases, so does the rate at which oxygen is given off by the aquatic plant. See diagrams c & d below…
Diagram c Diagram d
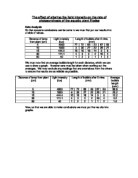
Results obtained from experiment : “Investigating if light intensity effects the rate of photosynthesis in an aquatic plant.”
As mentioned previously, the results I have obtained from the experiment will be of measured in 5 intervals, ranging from 0cm -100cm, 1 repeat reading taken as well as an original reading & an average of the 2 results calculated. The results are as tabulated below.
Test 1
Test 2
Average result
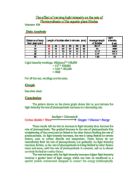
Analysis of results obtained : Curve Graph of results
As mentioned previously, I could construct one of 2 graphs (Diagrams c & d) though below, I have chosen to illustrate my results in the form of graph d, which demonstrates the theory behind the investigation (rate increases with light intensity) more clearly. This is why I calculated the reciprocal of distance (1 ) In the table of average results & not just distance as shown in the 2 tables prior to D
the results table.
Graph: Shows the effect of light intensity on the process of photosynthesis in an aquatic plant.
From my ascending graph , I can see clearly that as the light intensity the pond weed is provided with is increased, the rate at which oxygen bubbles are given off by the plant increases also. On analysing the data, you can also clearly see, that each new light intensity the pond weed was subjected to, gave results which increased steadily in comparison to the previous & next result. E.g.
3rd Light intensity = 0.02 Rate = 28.5
4th Light intensity = 0.04 Rate = 35.5
5th Light intensity = 1 Rate = 46.5
As can be seen from the rate results, the 4th result is almost 10 bubbles of oxygen bubbles more than the 3rd result, and almost 10 bubbles less that the 5th result.
This trend/pattern is carried out throughout the whole graph of results.
The most probable explanation for the results I gained; as mentioned previously in my introduction, as light is one of the factors required in order for photosynthesis to take place, as the intensity of the light is increased, photosynthesis is able to take place at a higher rate. (see page 1 Light in Photosynthesis)
However, this theory would not continue forever as long as the light intensity was increased further & further. At a point (which was not displayed on my graph, so logically this point is higher than the highest light intensity I provided the pond weed with) the rate of photosynthesis will stay steady , it will increase no further (see diagram e). The reason for this being that the other 3 “limiting factors” (CO2, water & chlorophyll) are required in a higher quantity too, for photosynthesis to continue increasing in rate.
To summarise: For the rate of photosynthesis to increase beyond a certain point, it cannot be relied on for just 1 of the 4 limiting factors to increase, after a certain point ALL must increase for the rate to increase.
Diagram e
Although I did not predict the information gained from my results listed above, it is fair to say that my original prediction is indeed correct. As I did predict the rate would increase with increasing light intensity, even though I did not conclude that after a certain point, that increasing rate could no longer purely depend on increasing light intensity.
Evaluation of Investigation
On analysing the results I gained in the final experiment, I conclude that my investigation was both considerably accurate & the results were reliable.
My reasons for believing my results are reliable & accurate are firstly, they agree with the theory behind the rate of photosynthesis when light intensity is increased, secondly the result which I gained compared accurately to my prediction, which was well thought out before it was made, and finally the results I gained for my final experiment differed so much to the results of my preliminary procedure which was very inaccurate. This proves that the new changes I made to the investigation were vital for reliability & accuracy of results.
Of course it is realized that the results I obtained are not completely faultless, and that some of this was down to the method I used & also for this experiment, the conditions in which it took place.
We found that photosynthesis can be highly influenced by the surroundings in which it took place. Our experiment took place over the period of 2 days, and on each day the experiment took place, the natural light conditions in the lab changed. This did not apply necessarily to my experiment, as the experiment I did took place in a fairly shaded area of the lab. On the other hand, other groups that completed the experiment did it in areas that were better supplied with natural light. This meant that our investigation was difficult to start, as the pond weed was finding the conditions we were working under inadequate for photosynthesis, whereas other groups were finding the investigation much easier to conduct.
Another aspect of my method which was faulted by the fact that the experiment took over 2 days was the fact that different numbers of people were using the electricity in the lab on different days. This meant one day, when few people were conducting the investigation out lamp was supplied with more electricity & was bright, on another occasion more people were sharing the electricity in the lab & the lamp providing light to the pond weed was dimmer. Though the lamp was not necessarily very bright one day & extremely dim the next day of the experiment, it could have made the difference of 10 or so centimetres distance to the light intensity supplied to the pond weed. Secondly, the water in which the pond weed was continually stored may have contained less carbon dioxide on one aspect of the experiment than on another aspect. This would indicate that less photosynthesis would take place, as carbon dioxide is one of the 2 products required by a green-plant for photosynthesis to take place.
A major aspect that could have affected the reliability of my results was the fact that I counted bubbles of oxygen. Number of bubbles indicates no real accurate idea of the amount of oxygen given off by the plant, but really just the rate at which oxygen is produced. The bubbles in my experiment were generally all similar in size (I noticed this, as it was an aspect I had thought about) however, it is impossible to say that they were all exactly the same size; some bubbles may have been larger & therefore contained more oxygen. Also there may have been some bubbles of oxygen that were missed by the counter, or very small. This particular point is unknown & down to human error, an aspect which always makes experiments a little inaccurate.
A way of getting around all the dilemma’s caused by counting the number of bubbles would be to set the experiment up as in diagram b, and measure volume of oxygen instead. I could not do this in my experiment as during my preliminary procedure, it was seen that not enough oxygen would be given off by the plant to measure volume of oxygen left within the test tube. This procedure (measuring volume of oxygen) also enables us to prove that the gas given off was indeed oxygen & therefore prove photosynthesis occurred. You could do this with the glowing splint test illustrated below in diagram f.
The only down point of only measuring volume is that it is not certain whether enough oxygen to measure accurately will be produced within a short time, 3 minutes for example. You would need to complete the experiment within a longer time, 10 minutes for example. This then make the investigation very long, if you are to take repeats & investigate a range of 5 measurements. A way of solving this problem, and make the investigation even more accurate, is to measure both volume of oxygen & number of bubbles, with this you can gather amount & rate effectively & in less time.
Diagram f
On considering my experiment, in hindsight, perhaps I would have gained an even higher rate of photosynthesis if I had made the temperature of the water slightly lower. 20 degrees centigrade is the recommended temperature for photosynthesis, and yet we conducted out experiment with the water around 25-27 degrees C, as I found that 20 degrees was a little low. If I had altered the water steadily by 1 degree, instead of making it 25 degrees C straight away, I may have found that the water only needed to be at 22 or 23 degrees, and the pond weed would have photosynthesised at a higher rate at this temperature.
On analysing the table of results for my 1st and 2nd test of the final experiment, it can be seen that the results of the 2nd test are always slightly lower than the 1st. Not one of the results for the different light intensities are completely the same. This gives the impression that my 2nd (repeat) results are more accurate than the 1st. The reason I believe this is because, as mentioned previously, the pond weed needed a certain amount of time to adjust to a new light intensity. We allowed this time to be 2 minutes. Perhaps though, to make the experiment more accurate & the results more reliable, I should have allowed 5 minutes instead. I could have seen if this was right by taking a 3rd result, and noting whether it was very similar to the 2nd result, but because the 2 results I did take were not totally unsimilar I did not do this.
I believe that my range of 5 distances (0cm to 100cm) was sufficient, although as mentioned above, I believe taking a 2nd repeat would have aided me in gaining a more accurate average result, and then also I would have discovered if the pond weed needed further time to adjust to a new light intensity.
These points I have mentioned above, did not seem to affect my results very badly. I did not have any result that were way off my line of best fit, and seemed odd to my graph.
Although as can be imagined, they were not all perfectly in a line. Some of the points on my graph were slightly out of place, and this could have been down to minor faults in my investigation, but nothing major and as mentioned before the points on my graph formed a consistent trend. This proves that my results are reliable and fairly accurate. My results also appear to agree with the information on the theories of photosynthesis, found in most biology texts; though I did not have enough evidence (results) to prove the theory which says that after a certain point the rate will cease to rise, as explained previously.
I found it quite challenging to complete this investigation as fairly & reliably as possible, though my results indicate this was reasonably well attained. I found it hard to conduct the experiment fairly mainly because it was hard to keep to the rules & limitations we set, as it was difficult to try and make the plant photosynthesise under our conditions, it is a living thing & cannot be forced. However, we did finally overcome this by adjusting the surroundings in which the experiment was taking place slightly without breaking the rules we set to conduct a fair test. We found difficultly also in controlling the other variables which cannot be adjusted easily, CO2 for example. A variable such as temperature could easily be adjusted to the conditions we decided to set our test under, but to adjust the levels of carbon dioxide; a natural gas in the surrounding air (or water in the case of our experiment) was extremely difficult. However, after our experiment had taken place we found that by changing the water after each test for the rate at which oxygen was given off, we would be providing the pond weed with the same levels of carbon dioxide each time. We did not do this in our experiment, though we did change the water several times, though not as consistently as this.
Plan for a new & improved experiment (changes to be made)
New equipment required: Pond weed (7-10cm)
5 different wattage bulbs for lamp (40 W, 60 W, 80 W, 100 W, 120 W)
Test tube
- Ensure pond weed (approx 7-10cm) has previously been kept in a well lit area, is very healthy & photosynthesising well ( Nip end of weed with nail)
-
Set up experiment in a dark room immediately (as in diagram b) – Ensure room available for at least 3 hours & you are not sharing electricity
- Place pond weed in fresh water (approx 23 degrees C)
- Place 40 W bulb 15 cm away from pond weed & leave to adjust for a timed 5 minutes
-
Begin investigation: Leave pond weed to photosynthesise for 5 minutes, counting number of bubbles given off, and noting general size in mm, after 5 minutes calculate amount of oxygen left in top of test tube. ( You also wish to conduct the glowing splint test to test the gas given off was oxygen diagram f)
-
Change water to ensure levels of CO2 are the same for the next test.
-
Take a repeat & if result is over 5 bubbles more than original result, take a 2nd repeat
- Repeat test for 60 W, 80 W, 100 W & 120 W bulbs. Refilling water after each test.
With this you should gain even more accurate & reliable results, although it is a very strict experiment, and the actions of the plant cannot be fully controlled.
Further Experiment
For further work, I could introduce the adjusting of a different limiting factor into the experiment, CO2 for example. By adjusting the levels of carbon dioxide available to the plant I could still measure whether this affects the rate of photosynthesis in pondweed.
I would conduct this experiment by exposing the water in which the pond weed was surrounded by to a range of levels of lime water, which would decrease the levels of CO2 when the amount of lime water is increased.
Plan for the investigation
Note: Conduct experiment in a well lit area, make sure light levels are never adjusted.
- Ensure pond weed (approx 7-10cm) has previously been kept in a well lit area, is very healthy & photosynthesising well ( Nip end of weed with nail)
-
Set up pond weed, as in Diagram b, in a large beaker of approximately 1 litre of fresh water at 23 degrees centigrade, covered by a funnel & test tube.
- Time for 5 minutes to allow the pond weed to adjust to the natural levels of the surroundings it is in
-
Begin investigation: Time with a stop clock for 5 minutes, counting the number of bubbles given off by the pondweed, then if there is a sufficient amount of gas within the test tube covering the funnel, calculate the amount of oxygen given off by the pond weed.
-
Change water to ensure initial CO2 levels are the same for the next test
-
Take a repeat result. If the repeat is over a sensible amount above the original result, take a 2nd repeat to gain a fair average.
- Repeat test for 4 more different levels of limewater to which the pondweed will be exposed. These being
Note: Change the water after each test to ensure same starting level of Carbon dioxide in water. Even though we are measuring whether the rate of photosynthesis is affected by different levels of exposure to CO2, It would only be a fair test if the different range of levels can clearly be measured, which they cannot be clearly measured if the test is conducted with the same water, even though the levels of CO2 would be different.
INVESTIGATING THE EFFECT OF LIGHT INTENSITY ON THE RATE OF PHOTOSYNTHESIS