Example
In the diagram above you can see a container with a semi permeable membrane in it. On the left hand side there’s pure water. On the right there is water with sugar. You can see some of the water molecules are bound to the sugar. The sugar molecules are therefore bigger and so they will take longer to pass through the membrane then water molecules. The smaller water molecules will be able to pass to the region of lower concentration (in this case the right hand side) quicker then the sugar therefore there will be more liquid at the right hand side as water concentrations will even out quicker then the sugar concentrations.
Expected results
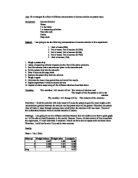
The data I expect to get would look something like the following graph.
I expect the piece of potato to be more and more flexible as the concentration will be getting higher and higher so the distance from the ruler would be longer. I think that as the concentration gets lower the difference between the points (in flexibility) would be getting smaller and smaller as when the cells would be plasmolysed to a certain level they can’t really be plasmolysed any further. At the other end it would be just the same as the cells would be more and more turgid and finally it would get to a point where they can’t be any more turgid. This is because of the cell wall which doesn’t allow the cell to explode (like in animal cell) or to just disappear).
When measuring the volume of the piece of potato I expect to get these results. As the concentration of water will get lower the
The difference between points (in cm’s3) would get smaller and smaller as the cells in the potato piece will be getting to the state of maximal plasmolysation from which it can’t get any smaller. This is because of the cell wall which doesn’t allow the cell to explode (like in animal cell) or to just disappear).
Variables
In this experiment my independent variable will be the concentration of sucrose in the solution to which the potato will be put in.
The output variables or the dependent variables will be the flexibility and volume.
Variables that could also affect my results could be:
- The temperature in the room. If the temperature is different for each result then the piece of potato will be either drier therefore it wouldn’t have that much weight on it (less water) so the test for flexibility wouldn’t be fair, or too cold which means water wouldn’t evaporate of the piece of potato so it would still be heave so the test for flexibility wouldn’t be fair again. Also if it’s too hot some of the water from the beaker could evaporate therefore the concentration would change as the amount of sugar would stay the same and there would be less water.
- The temperature of the liquid. If the temperature of the liquid is different for each result then it’s unfair as in the piece of potato which is in the hotter liquid osmosis will occur faster as the water molecules will move around faster.
- The time for which the piece of potato stays in the liquid. Must be the same for all the measurements.
- The material that the container is made from. If the material that the container is made from is different for every experiment than then there would be a difference in temperature as the containers would conduct heat at different rates
- The type, shape, surface area and volume of all pieces of potato must be the same otherwise:
- there would be more surface area for osmosis to occur
- some shapes wouldn’t bend as much so when measuring their flexibility the result obtained will be wrong
- if using two different types of potatoes the result for each type so the whole experiment must only be done with one type of potato
Apparatus list
- a potato (you must be able to cut out a section of 5cm x 2cm x 5cm or
3cm x 4cm x 5cm from it )
- 12 plastic 250ml containers
- a clamp stand
- a thin plastic ruler
- piece of plastic size 3 x 3 or another thin ruler
- a piece of rubber
- 12 labels (stickers)
- pen
- sucrose solution
- distilled water
- a stop clock
- a results table
Procedure
- Clean up your working area. Make sure that there’s nothing there except the items you need.
- Take 12 plastic 250 ml containers and line them on your desk. Label them: 0%, 5%, 10%, 20%, 30%, 40%, 50%, 60%, 70%, 80%, 90% and 100%. This is the concentration of water you’re supposed to have in each of them. To make it easier, the best amount of liquid to use is 100 ml.
- Set up a clamp stand as shown in the diagram.
- Make the solutions you need by adding the amounts of water and sucrose which are shown in the table. Stir them all.
- Take the potato, peel the skin off and cut out a section of 3cm x 2cm x 5cm or 3cm x 4cm x 5cm from it.
- Divide up your section into pieces off 5 x 1 x 1.
- Start the stop clock and insert a piece of tomato into the container marked ‘0%’
- After a minute put another piece into a beaker labelled ‘5%’ and so on so forth.
- Remember that your supposed to measure the flexibility and volume after 12 minutes so the moment you put the last piece of potato in you take the first one you did and you measure lengths of three sides (we will use these to work out the volume) and put them in your results table. Then as shown in the diagram you put it in clamp stand and measure the distance from the top end of the potato to the ruler. Remember that only one cm is supposed to be in the clamp and don’t turn the adjustment knob too much – just enough to hold the piece of potato.
- You’ve got a minute to collect your data before you have to collect data from the next container.
- When collected the last result you may stop the stopwatch and empty the containers to the sink. Then you may put away the rest of the equipment.
Measurements
On every piece of potato you will take two measurements – one for flexibility and one for volume. Don’t bother working out the volume during the experiment, just put the three needed lengths and work it out later. The smallest value which you will get for flexibility will be 0cm the biggest around 3.5, 4cm. For volume the smallest you will get is around 4 and the biggest is around 5.8. For measuring flexibility the ruler which you’re measuring with should be at 90 degrees to the ruler on the top and also toughing the end of the potato.
Fairness precautions
First thing to do to make an experiment a fair one is to check that all the other variables remain the same during the whole experiment so that they’re not affecting my results. The temperature in the lab will stay the same as there is thermostat there and if I’m not sure about that, I can ask the teacher or the technician before doing my experiment. I will make sure that the temperature of the liquid is the same in all the containers by using a thermometer. Also I will only hold the container at the top where there is no liquid on the other side of the plastic to makes sure that I don’t transfer my body heat into in after I’ve measured the temperature. I will use a stop clock to control the time but before I use a stop clock I’ll check it with another one to make sure that it’s working properly. I might actually use two stop clocks in case one breaks during the experiment. When selecting my 12 containers I’ll make sure that they’re not leaking and wash them with hot water before using them as I don’t know what experiment they were used for before. I will also double check that they are all the same size. To make sure that type, shape, surface area and volume of all the pieces of potato are the same I will check that they were taken out of the same packet of potatoes which I suppose guarantees approximately same age and type. I will cut out the pieces using a knife and ruler and double check all my measurements to make sure that I’m getting them all right.
Safety
To make my experiment safe for me and for other people I would clear up my working space before starting the experiment and make sure that when doing my experiment I will not place any equipment close to the edge of the desk where it’s likely to fall on my/somebody’s foot and damage it. Also before starting my experiment I will put all my stuff (bag, folders and pencil case) on the windowsill so that nobody trips on it and so I’ve got more working space.
Also I chose a plastic container instead of a glass one as glass beakers are easy to break and when they do break, the glass pieces which are left of them have very sharp edges and are quite dangerous.
Data recording
The data I need to record [the flexibility and the volume] will be recorded in a table such as this one:
Data presentation
I will collect the data that I will collect in this experiment as data tables and graphs. For the flexibility I will have a graph such as this one:
I will present this graph with the data that this graph was made from. Also I might have a graph showing the difference between 1st and 2nd point and then with 2nd and 3rd and so on. I might also present the data on a bar graph and have line of best fit drawn on it.
For the volume I might have a graph looking something like this:
This one would be presented with a data table that it was made from. Also I might have a graph showing the difference between 1st and 2nd point and then with 2nd and 3rd and so on. Or I could have a smooth line graph with a linear line of best fit.