For my investigation I am going to test five different strength concentrations of Hydrochloric Acid against Sodium Thiosulphate.
This is the procedure I will use for my method: I will use 20mls of each of the liquids and I will pour the 20ml of Sodium Thiosulphate into a clean conical flask, followed by the 20mls of the required strength acid. I will leave these liquids to react together naturally, but I will time on a stop clock how long it takes before the solution looks is too cloudy for me to see the black cross on the tile underneath the flask.
I am going to make each different concentration of hydrochloric acid myself by using 1 molar hydrochloric acid and distilled water to dilute when needed. Using the measuring cylinder, I will add however much water is needed to the hydrochloric acid to make it 0.2 molar, 0.4 molar, 0.6 molar, 0.8 molar or which ever strength is needed. The one molar strength test will use the hydrochloric acid straight from the bottle.
When I can no longer see the black cross on the tile beneath the beaker, I know this is when the reaction has taken place and consequently the correct time to stop the clock.
I can then write down my results in a table and can move to work out the actual rate of reaction. This can be done by dividing the number 1 by the varying times in order to acquire the rate of the reaction. I also will record these results also. Since these numbers will be small and quite complicated I am going to add a further column to my final table of results and record the answers in standard form. After doing this I will have a complete set of results ready for analyzing and comparing.
I am going to will take three sets of results for each different concentration of acid so that any inaccurate results are averaged out.
I have already carried out a pilot test (sometimes known as a preliminary experiment). This will help me to get an idea for the results I will obtain in the real experiment and so will make my prediction more accurate.
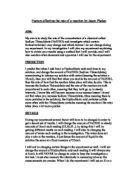
In my pilot test I used zinc granules and different strength concentrations of hydrochloric acid. I timed how long it took for the zinc granules to disappear in each concentration of acid. I started with 0.2 molar then moved onto 0.4, 0.6, 0.8 and 1 molar. Like the proper investigation I used distilled water to get these different concentrations. I recorded my results in a table:
These are the results I have obtained from the pilot test. They are quite good accurate results as both times on most of the concentration strengths were similar and so I got a good set of averaged times.
From looking at these results I can see that my pilot test graph is going to curve downwards. I will now draw this graph.
Now I have completed my pilot (preliminary) experiment, I can make a prediction relating to the final experiment which I will analyse in this investigation.
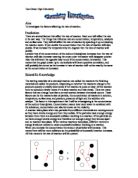
From looking at my pilot results and graph and from what I’ve been taught in lessons I can make a justified prediction that, as I increase the concentration of the hydrochloric acid, the rate of reaction will also increase, meaning that the higher concentration reactions will have more collisions per second between particles and therefore will react more quickly. This relates to the concentration diagram on my first page which shows high and low concentrations and that the stronger / higher the concentration, the more particles the solution will have in a given area.
Therefore overall I predict that the fastest reaction will be the sodium thiosulphate mixed with 1.0 molar hydrochloric acid and the slowest, sodium thiosulphate with 0.2 molar solution of hydrochloric acid.
Since the rate of reaction increases as the concentration increases I will expect the rate of reaction graph to have a reasonably strong, positive correlation and the time graph a strong negative correlation.
I predict that the rate of reaction graph may look like the one below:
I predict that my time / concentration graph will look like this:
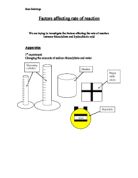
This is a diagram and a list of my equipment when set up and ready to use:
- Stop Clock
- Hydrochloric Acid - HCl
- Distilled Water
-
Sodium Thiosulphate - Na2S2O3
- Ceramic tile with large black tape cross
- Conical Flask (2)
- Measuring Cylinder (2)
However before I start my experiment I need to make sure that I am safe. I will make sure of this by wearing goggles and being sensible when pouring acids as a spillage could lead to a nasty burn. I will take great care not to drop any fragile glass apparatus as these can cut people and I will make sure no one is running in the laboratory as this could lead to an accident. If I make sure I follow these few safety procedures, I know that my investigation is safe and that know one will get hurt.
There were several factors in my investigation. The ones I kept controlled (the same) were the Sodium Thiosulphate, the Hydrochloric Acid and also the same amount of acid used (20ml) and overall amount (40ml in total). I kept these three things constant and controlled as changing them would result in an unfair experiment which could lead to anomalous results.
The Variables which I am measuring were the time taken for the two substances to fully react in seconds.
Also I am measuring the concentration of the acid. I changed these two factors as I need to obtain results otherwise the investigation cannot be compared and I can not make any conclusions.
Finally the last variables are the ones which I am deliberately changing. The main variable here which I chose to change is the concentration of the Hydrochloric Acid. I could have changed a number of variables which all would have affected the rate of reaction but I decided to choose this one as it is the most easily changed (as described on page four).
As mentioned on previous page, I made this test fair by doing several things.
I only changed the concentration of the Hydrochloric Acid (and nothing else), I cleaned out the cylinder and conical flask after each use so that no weaker or stronger acid was still present. Finally, I made sure it was always the same person who looked to see if the black tape cross was still visible so that I knew when to stop the stop clock. This was quite important as some people may have better eyesight than others and so may still see the cross when it’s not visible to others.
I followed my method and obtained a good set of results. I recorded them in a table like this one:
The rate of reaction is worked out by doing the sum 1 / x where x = the average time in seconds.
The last column on my table has the same results as the 6th column, however they are shown in standard form as they are complicated numbers and it is easier to draw the results on a graph when in this form.
I will now move onto drawing my results but shown in graphs.
On the next page are the two graphs which I have drawn in relation to my results.
From looking at the two graphs I can clearly see that I was to an extent correct with my predicted graphs as they did both look similar to the ones I had already drawn.
In terms of the rate of reaction / concentration graph, it did have a strong positive correlation and this was because the rate of reaction sped up as I increased the number of acid particles in a given area. With more acid particles there was a lot more chance of the reactants colliding and this showed with the fast rate of reaction. However the graph which I earlier predicted this one would look like had a gradual curve as one of the reactants was gradually running out. My graph which contained my results did not have this curve and there are a couple of reasons why that might well have happened.
Firstly I decided that a straight line of best fit drawn with a ruler was more suitable for joining my points than a curve was. Therefore I was partially wrong with my prediction and this could be explained by the fact that I did not have the time to take more results at more intervals and if I had done this then I think I would have got a curve. However with just five different concentrations I did not have enough results to produce a curve and with ten or fifteen different concentrations I think I would have obtained a smooth curve and this would have corrected my prediction.
The differences between the rates of reactions in my results went up in fairly even jumps with most of the gaps between the concentrations increasing by about ten seconds and staying fairly constant.
Most of my results were fine except from one anomalous result which was the second time measurement for the 0.2 concentration. My first result for the 0.2 concentration took 94.86 seconds before the black tape cross was no longer visible. However my second result for the same concentration came out at 130.06 seconds, which is approximately 35 seconds outside the previous value and this is too much as really there should be a difference of about 10 seconds at the most.
There could have been several things which may have lead to this anomalous result.
Firstly, with the lower concentration tests it is a lot easier to make a bigger error. For example, if I was to just pour 0.5ml more acid into the conical flask than I was meant to. This would be a 10% increase on the amount of acid and so this would lead to a 10 second time difference. So if I was to measure the acid incorrectly by 1.0ml, I would get a 20% increase on the amount of acid and this would lead to a 20 second difference.
This could explain that anomalous result that I got but also there is another reason which could explain it.
After each measurement on each concentration, I have to wash out the beaker using tap water so that the flask is not contaminated with weaker or stronger acid. However the tap water in which I am washed the flask in is quite cold and so when the beaker is colder this would slow the rate of reaction and take longer, (as explained on page 2).
A combination of these two above things explains why I got my freak result of 130.06 seconds on the 0.2 concentration test.
In terms of my second graph (the one with time up the y axis and concentration along x axis), I was again partially correct but I had the same problem as the first where I predicted the correct strong, negative correlation; I just wrongly predicted that my graph would have a curve at the start. The points which I had were such that the only really suitable option left open to me was to draw a straight line of best fit instead of a curve.
Again like the first graph, if I had more time to carry out my practical experiments, I could have done far more intervals and concentrations and this would have enabled me to obtain a nice smooth curve at the start on this graph.
In the second graph, the steps downward between the times different concentrations took to react did not change much. These are the rises between each average time:
0.2 molar acid = 113.02 seconds
0.4 molar acid = 96.47 seconds
0.6 molar acid = 83.31 seconds
0.8 molar acid = 75.81 seconds
1.0 molar acid = 64.48 seconds
The first result is expected to be larger so this is not analyzed. As you can see above, all the differences are between 10 – 15 seconds except for the 0.6 to 0.8 concentration average time which is quite far below at 7.5 seconds. This could be the result of one of the changing factors which I mentioned earlier.
Apart from a few small errors in my original prediction, I am still able to look at my results and make a firm conclusion. I have carried out my experiment and have been able to prove the theories which I talked about frequently on the first few pages. The concentration theory in particular which when the acid concentration is high, the rate of reaction is also going to be fast. When a substance has a low concentration it means that there are not many reactant particles in it. As there are so few reactant collisions between them, it takes longer for the reactant particles to fully react and so the rate of reaction is going to be slower.
As the concentration of a substance (in my case hydrochloric acid), increases the number of reactant particles also increases in it. This means that more and more collisions take place causing the reaction to react at a faster speed. As the concentration continues to rise the reactions take place more quickly. This is clearly shown in my results where as the concentration of the hydrochloric acid went up, the speed at which the reaction took place increased. This meant that the rate of my reactions increased also.
Below I have included the balanced chemical formula for my experiment.
Sodium Thiosulphate + Hydrochloric acid → Sodium Chloride + Water + Sulphur Dioxide
Na2S2O3 + 2HCl → 2NaCl + H2O + 2SO2
I am now going to evaluate my investigation and discuss how well I think I have worked on this to achieve my aim.
In my opinion I have worked well in this investigation and with lots of enthusiasm. I think that the experiment has gone well and this is reflected in my good set of results. I have been able to explore theories and analyse my results which has lead me to make a firm conclusion that as the concentration of acid increases, the rate of reaction also increases. I have been able to partially prove my predication from two graphs which contained my results.
I feel that my results which I obtained from the experiment were quite good and strong as there was only really one anomalous result which was easily explained (on page 10).
I made sure that they were good overall results by keeping the investigation always safe and always fair. I noted earlier how I was going to achieve these things. For example I washed the conical flask after every experiment and I used the same water so that every test had the same conditions. I also made sure that it was the same person who checked to see when the cross had disappeared each time. I made sure of this as different people could have poorer or better eyesight’s, so to change the person half way through would not be logical. Another thing I did to make sure my results were strong and accurate was to take averages from the three tests which I performed. This helped me to cancel out anomalous results such as the second test for the 0.2 concentration acid which came out as 130 seconds. However it could have been made even more accurate by taking even more tests for each acid concentration.
I could make the experiment more accurate and reliable by using a different conical flask for each test on each concentration. However this would be time consuming and at the end of the say all the conical flasks are washed in the same way and so me or a lab technician washing them would not make a difference.
After another look at all my graphs, prior knowledge and my tabulated results, I am able to make a final firm conclusion that, when the concentrations of one of the reactants is increased, more particles are in the solution and so there is more chance of the particles hitting other particles. This means there would ultimately be more collisions and so a faster rate of reaction. From this I can also say that a solution with a lower concentration will be the opposite and so will have fewer particles in the solution. Therefore a lower concentration will have a slower rate of reaction
There are a few further experiments I could carry out which would relate to this one.
Firstly, I could change the substance I am using and I could use something different instead of sodium thiosulphate or even change the acid from hydrochloric to nitric or sulphuric.
Another thing I could do to change this investigation is to change a different factor of the five (as mentioned in first two pages of this investigation).
I have already used and changed the concentration factor in this investigation and so in another investigation I could change the pressure which when increased, also increases the rate of reaction. The temperature which when higher increases the rate of reaction. The surface area or I could even add a catalyst which would reduce the activation energy, therefore shortening the time to react and increasing the rate of reaction.
With each of these I could then carry out the same sort of procedure as in this investigation and could record my results and compare.
Overall I feel I have worked well in this investigation, proved a few theories and have achieved my aim of investigating the factors which affect the rate of reaction.