Planning
Equipment Needed.
- Test Tube(s)
- 1 Potato
- Ruler
- Hydrogen Peroxide
- 11mm Borer
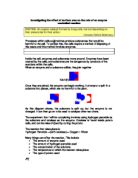
This is the set-up that I will require for my experiment:
The potato is the source of the catalase, and the hydrogen peroxide is the substrate. The oxygen is collected in the test tube.
The reaction is
2H2O2 →(with catalase) → O2 + 2H2O
The factor that I am going to investigate is the surface area of the potato.
The piece of potato that I will be using is cylindrical, so the surface area can be mathematically calculated.
The standard piece of potato for each test will be four centimetres long, and will have a diameter of 1.1 centimetres.
To give different surface areas to test, the cylindrical potato section will be split horizontally into different numbers of pieces, from 1 to 6.
This gives the following range of surface areas:
The final measurements that I will collect are the times taken for the reaction too produce 10ml of oxygen.
Prediction
I predict that when there is a greater surface area, more catalase can leave the potato. With a greater amount of this enzyme in the solution, the reactions should occur more often, producing more oxygen, so the tube will fill faster.
If my prediction is correct, the graph should look like this:
I think that there may be a direct relationship between the surface area and the oxygen produced – doubling the surface area will double the rate of reaction, therefore halving the time taken for the tube to fill.
Results
The results that I recorded were as follows:
Table to show the time taken for 10ml of oxygen collect with different numbers of potato pieces
From these results I was able to create this graph
However, this does not give a very useful display, as the data is graphed by number of pieces rather that the surface area. To give a more useful visual display of the results, I created the following graph:
Although these results are not exactly correlating, there is a trend of negative correlation. This shows that the overall prediction was correct, and the larger surface area, the less time is taken for oxygen to be produced. However, some of the results were anomalous. The table below highlights the results that I consider to be anomalous, and the recalculated averages.
I then graphed the averages again, ignoring those that I considered anomalous.
Steady Negative Correlation
Negative Correlation Flattening out at end
This graph displays the trend more clearly, showing that there is a correlation between the surface area and time taken for oxygen to collect. However, the graph can either be viewed as a steady negative trend, or as a line with negative correlation that flattens out at a surface area of between fifteen and twenty cm³. This would indicate that this time (approx 2½ mins) is the shortest time in which 10ml of oxygen can be collected using the amount of catalase available. Although the catalase reacts more when the potato has a larger surface area, there is not an infinite amount of catalase. As the initial pieces of potato were the same, they all contained the same amount of catalase. This amount of catalase may be enough to produce 10ml of oxygen in around 2½ minutes, but it may not be possible for the reaction to work any faster.
However, there were not enough accurate results to show if the prediction ‘doubling the surface area would double the rate of reaction, therefore halving the time taken for the tube to fill’ was correct.
To ensure that my results showed the correct pattern, I asked another group to check that the readings followed a similar pattern. Although I was unable to obtain any actual readings from them, I was told that they had found a similar pattern – the larger the surface area, the faster the rate of reaction.
Evaluation
Although the results were enough to show a trend, they were not very accurate. This could be due to a number of factors, including:
- Inaccurate readings – the readings of the time may be inaccurate, as they were dependant on human observation of 10ml of oxygen being collected, and a human stopping the stopwatch
- Different potatoes – different potatoes were used for experiment 1 and experiment 2. These will have been different in some way (type, age, temperature, time since harvest etc)
- Different parts of potato – The pieces used were taken from throughout the potato. I do not know about potato anatomy, but there may be more catalase in the centre, or at the bottom of the potato
- Inaccurate equipment – not all of the equipment was accurate, so other variables could have changed.
To improve the experiment, further work would have to be done on controlling the variables stated above. However, as some of these are very difficult to control, I would like to repeat the tests more then twice. In an ideal situation, I would repeat the test over ten times to get an accurate result. However, realistically, there would not be time for a large number of repeats to take place. To improve the inaccurate readings, next time I will use data logging equipment so it will record accurately and reliably. Overall I feel that the experiment was a learning curve, but know I know how to conduct the experiment in an efficient way, I will be able to conduct the experiment without any anomalies. (hopefully)