temperature of an object is (under certain assumptions) directly proportional to the difference between the temperature of the object and the (assumed constant) temperature of the environment. So as explained above, the temperature of the object can also sometimes be directly proportional as well as a pose to being proportional.
So basically Newton’s law of cooling explains how the surface temperature of an object changes at the rate that is either proportional or directly proportional to is relative temperature.
That is, the difference between its temperature and the temperature of the surrounding environment.
Other than just studying the factual theory behind this investigation, I have also done some preliminary work.
My preliminary work was based on “What effect does insulation have on the rate of cooling water”.
This is what I did:
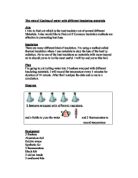
- I took two beakers.
- I wrapped bubble warp around one of the beakers, to act as an air insulator.
- I left the other beaker as it was, but put cards on top of both beakers, to prevent evaporation of water from the beaker to get accurate results.
- Water was boiled and put in to the two beakers, and stopwatch started.
- Results were taken every 1-minute, for a total of 30 minutes.
My results are as follows:
I found from my preliminary work that insulated beaker manages to hold the temperature of water at 88 degrees when the stopwatch is started, however the un-insulated beaker only manages 79 degrees. Since air is a poor conductor of HEAT, this shows that the air pockets in the bubble wrap provided useful insulation against heat loss. This effect can also been seen at the end of the experiment. However heat loss is only prevented to a certain degree of level and not completely. The reason why my results quiet clearly the effect of insulation on the rate of cooling water is because there was hardly any other way by which heat could be lost other than evaporation. However evaporation was not possible since a card that was placed on top of both beakers was preventing it.
Now that I have concluded all the information from my preliminary work, I am going to carry out my actual experiment but before I carry it out, I have decided to change a few factors based on my information obtained from my preliminary work.
These improvements are as follows:
- The beaker will have no insulation around it, to prevent heat loss.
- There will be no card placed on top of the beaker, to prevent evaporation.
- There will be no factors involved in this experiment that prevent heat loss, other than the natural factors (e.g. evaporation).
- The total time period for the whole experiment will be 30 minutes rather than 20 minutes. This will allow the water temperature to drop from boiling (at start of experiment), to room temperature (at end of experiment).
List of Equipment:
- 1 Stopwatch.
- 1 Beaker.
- 1 Boiling Thermos.
- water (300 ml).
- 1 Thermometer.
Method for carrying out Experiment:
- Place all the equipment on the desk.
- Make two result tables.
- Put the water into the boiling thermos.
- Boil the water and then pour it into the beaker.
- Make sure that the volume of water is accurately measured (150ml).
- Place the thermometer into the beaker.
- Wait for the temperature to rise to its limit, before taking any readings or starting the stopwatch.
- Once that is done, then only take the reading of the temperature of water and start the stopwatch immediately.
- Take the temperature reading after every 1-minute.
- Keep taking the readings until the stopwatch reads 30 minutes.
- Once the 30 minutes have passed, make sure u have 30 sets of results.
- Get rid of the water; make sure that the temperature of the thermometer is at room temperature.
- And finally once step 12 has been performed re-peat the same procedure once again, with the same accuracy as before.
Make sure you have two sets of results at the end of the experiment.
Method for collecting and organizing Evidence:
- Make two table of results, exactly the same for taking down the readings:
Table 1 Table 2
Make sure the tables extend down to 30 minutes.
- Plot two separate graphs from the results collected in the table of results. Making sure that each graph has its proper heading (Time against temperature of water graph 1 & 2) and units.
- Once the graphs have been made neatly and accurately, on the same graphs take 10 points from each graph and find their gradients, using tangents.
- Make sure the gradients are written down in a table:
- Finally plot one more graph, using the gradients calculated against the time (minutes).
I predict that as soon as I pour the boiling water into the beaker the water will begin to cool down, quiet fast at first but then the rate of cooling will start to slow down and eventually stop cooling as the temperature of the water levels off with the temperature of the surroundings i.e. the room temperature.
Therefore my line of best fit would have to be curve and hence would form a horizontal line at the end of the experient.
My prediction is based on Newton’s law of cooling as the law states; the rate of change of the temperature of an object is proportional to the difference between its own temperature and the ambient temperature (i.e. the temperature of its surroundings).
However my prediction does not say weather the relationship between the two factors is going to be proportional because I also predict that the temperature will decrease in such a fashion that a curve is formed on my graphs, rather than a straight line, which means that my relationship would not be proportional or directly proportional.
Table of Results
Table 1 Table 2
Table for calculating the Gradients
Table for graph 1
Table for graph 2
Analysis And Conclusion
As shown earlier on my two graphs, temperature of water against time graphs 1 & 2, my lines of best fits were not straight lines but curves. This shows that the gradients of the two lines get flatter as time passes by. Hence shows that the temperature of water decreases exponentially. However these two factors are not linked in such a way that they are proportional or directly proportion to each other, as a straight line can only represent this relationship. To further expand my understanding I plotted two separate graphs, which represented the gradient of my original two graphs. Both of the gradients against temperature show a strong positive relationship between them. Hence I can conclude that they show, the gradient of the curve is directly proportional to the temperature. This can been seen by extending both lines on these two graphs.
My prediction was correct. This is because I found by my results and observations that as soon as I pour the boiling water in to the beaker, it began to cool. This cooling process was rapid at first, but as the time period increased, it leveled off with the surroundings temperature. My results show that the lowest temperature the water reached in my case was 47 degrees, which was not the room temperature. However as the water was still cooling, it would have had eventually reached the room temperature. A horizontal line with a gradient of 0 would have had represented this information. So my results show that it would have taken the water more than 30 minutes to reach the actual room temperature. This is also the reason why my prediction about the graph forming a horizontal line at the end of the experiment, is not clearly shown.
There were certainly a few errors recorded/outlined on my graphs. Two of the errors were highlighted on the temperature of water against time graph 1. And there was 1 error on the temperature of water against time graph 2. Even thou these points are likely to be errors, they are not major ones.
Evaluation
I think that my plan was not efficient enough to allow me to obtain results that were totally error free. Hence I have realized that my plan contained some major sources of error.
I could have had used what is effectively know as a data logger. This is an electronic device that can be used to record the temperature results automatically, with a preset time limit. Placing the device in the cooling water can do this. Hence improving the accuracy of experiment as a whole by eliminating the error margin that comes by recording the results by the naked eye.
This experiment proved to be a success altogether as it agreed with my predictions as well as the scientific knowledge I obtained.
However I am going to continue my research by performing another experiment but this time one which involves a solid object and investigate how its rate of cooling is affected over a specific time period.