Below is the relevant equation: -
Sodium thiosulphate + hydrochloric acid sulphur + sulphur dioxide + sodium
chloride + water.
Na2S2O3 (aq) + 2HCl (aq) S (s) + S2O (g) + 2NaCl (aq) + H2O (L)
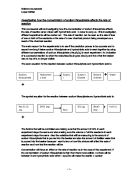
Taking into consideration all of the above points, I believe that the graph of results will take roughly this shape: -
This would show, in accordance with my prediction, that the higher the concentration, the lower the reaction time.
Apparatus: -
A 10cm³ measuring cylinder which measures to 0.1cm³.
A conical flask.
A laminated cross.
A small beaker.
A stop clock.
A thermometer.
2 Burette stands.
2 Burettes, which both measure to ±0.1cm³. thermometer
2 funnels.
Hydrochloric acid of original concentration 1mol/dm³.
Sodium thiosulphate of original concentration 20g/dm³
Preliminary Method.
Before performing the actual experiment, I am going to perform a trial run to ascertain the best method of obtaining accurate and time efficient results.
For the trial run, I plan to make two observations, one at each end of my selected range of concentration, i.e. 10 – 50 cm³ of sodium thiosulphate. In this preliminary experiment I will try and ensure a fair test by using a constant amount and concentration of hydrochloric acid for 10 and 50cm³. Also, to try and maintain the temperature, which can increase the rate of reaction, I will check the temperature every time the experiment is performed as, due to the nature of the experiment, it cannot be completed in a short space of time, and may take several time periods on different days. Therefore it is important to record the temperature as it may differ with the outside weather, and this difference could potentially drastically alter the time the reactants take to react.
I am also planning to use burettes and a small measuring cylinder (for the hydrochloric acid) which both measure to ±0.1cm³, to ensure the highest possible level of accuracy. I will take all my measurements with the meniscus resting on the required measurement, again, to ensure accurate results. Conical flasks will be rinsed thoroughly before being reused, which we will do as there are limited conical flasks within the laboratory. Finally, we kept constant the person who watched the solution to see when they could no longer see the cross. This ensured that results would not differ due to differences in eyesight, and maintained the quality.
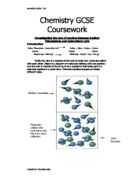
- I will firstly measure out 10cm³ sodium thiosulphate using the burette and a funnel into a conical flask.
- I will then add 40cm³ water to the sodium thiosulphate from a second burette, which I filled using a small beaker and a funnel, making sure the tap was closed before proceeding.
- Next I will measure out 10cm³ of hydrochloric acid into a small measuring cylinder.
- I will place the conical flask containing the sodium thiosulphate and water onto a laminated diagram of a cross.
- My partner will then pour in the hydrochloric acid whilst I activate the stop clock.
- My partner will watch the solution to see when the cross is no longer visible, and deactivate the stop clock.
- When the reaction is complete, the results must be recorded in a table.
- Whilst they are observing, I will prepare the other water and sodium thiosulphate solutions so as to make best use of the time available.
I will then repeat the points 1 to 7 for 50cm³ of sodium thiosulphate and 0cm³ of water, using the same amount of hydrochloric acid.
Preliminary Results.
The temperature on the day of obtaining these results was 21ºC.
Contrary to the preliminary method, 20cm³ of hydrochloric acid was used. The reasons for this are explained below: -
From performing the trial experiment I have found that 10cm³ of Hydrochloric acid lengthens the time the experiment takes. The first reading which was taken, which is not recorded, had taken 16 minutes and very little precipitation was evident within this time. It was decided that 16 minutes was too long and the test was abandoned. Therefore, it was decided that 20cm³ hydrochloric acid would be used in the actual experiment. This will hopefully make the experiment more time efficient.
With this in mind, we will need to add another 10cm³ measuring cylinder to our apparatus which has the same level of accuracy; i.e. ±0.1cm³.
Revised method.
- I will firstly measure out 10cm³ sodium thiosulphate using the burette and a funnel into a conical flask.
- I will then add 40cm³ water to the sodium thiosulphate from a second burette, which I filled using a small beaker and a funnel, making sure the tap was closed before proceeding.
- Next I will measure out 20cm³ of hydrochloric acid into a small measuring cylinder.
- I will place the conical flask containing the sodium thiosulphate and water onto a laminated diagram of a cross.
- My partner will then pour in the hydrochloric acid whilst I activate the stop clock.
- My partner will watch the solution to see when the cross is no longer visible, and deactivate the stop clock.
- When the reaction is complete, the results must be recorded in a table.
- Whilst they are observing, I will prepare the other water and sodium thiosulphate solutions so as to make best use of the time available.
I will then repeat the points 1 to 7 three times for each concentration of sodium thiosulphate to ensure accuracy, using the same amount of hydrochloric acid. Any anomalous results will be repeated. I will then take the average of each set of three results to plot on a graph.
Safety: -
Goggles must be worn to protect the eyes.
A lab coat must be worn and fastened to protect clothes.
One must be aware of the dangers that the chemicals in use present: -
Hydrochloric acid is corrosive – any spills must be thoroughly washed immediately.
Sodium Thiosulphate is harmful – hands must be washed after use.
Be careful when handling burettes – they are long, thin and fragile, and are easily broken if mishandled. Any breakages must be reported immediately.
Results: -
NB: -
The first two results recorded were taken on a day when the room temperature was 21ºC.
All the other results in the above table were taken on a day when the room temperature had dropped to 18ºC.
Conclusion: -
Having successfully completed the investigation, I have come to the conclusion that, as stated in my prediction, the rate of the reaction between sodium thiosulphate and hydrochloric acid can be sped up by using a higher concentration of sodium thiosulphate, i.e. the higher the concentration, the quicker the reaction takes place. This is because, as previously illustrated with an annotated diagram, the higher the concentration the more particles there are which are available to react. As previously explained, not all particles have enough energy to be able to react, i.e. not enough activation energy. If there are more particles to begin with, there is more of a chance that a fair number of them will have enough activation energy to break bonds. For example, say 30% of particles in a high concentration of sodium thiosulphate had sufficient energy to react. That 30% is more than the 30% of particles in a lower concentration of sodium thiosulphate that has enough energy to react, as there are less particles in a lower concentration than in a higher concentration. Or, to put it another way, say 20% of particles had sufficient energy to break bonds, in any concentration of sodium thiosulphate. That 20% in a higher concentration of sodium thiosulphate would be made up of more particles than 20% of particles in a lower concentration of sodium thiosulphate, as in a lower concentration there were fewer particles to begin with.
So, a higher concentration of sodium thiosulphate will have more particles with sufficient activation energy in it, and therefore a higher concentration of the aforementioned chemical will have an increased rate of reaction when mixed with hydrochloric acid than a lower concentration of sodium thiosulphate would have in the same environment.
We can see this from the graph. As the volume of sodium thiosulphate increases, the time decreases steadily. This is clearly marked on the graph. Double the concentration equals half the time after a certain point. Take, for example, the values x=20 cm³, y=4 minutes and x=40 cm³, y=1.6 minutes. From these points on the graph we can see the relevance of this point: - 20x2=40, half of 4 is 2, and the time at a volume of 20 cm³, is just under 2.
All this evidence proves that my prediction was indeed correct, and the investigation itself has proved the theories stated there.
I did attempt to plot a graph showing rate against time, finding the rate by 1/time, but, unfortunately, this graph looked totally unlike what I thought it should look like, which convinced me that there was some error and therefore I have not included it.
Evaluation: -
Improvements: -
The biggest factor which affected the rate of reaction in my experiment was the temperature. It was almost impossible to keep it constant, especially as the weather is changeable at the time of year in which the experiment was performed. This could be remedied by using some sort of thermos control, for example; a water bath. The temperature of a body of water can be kept constant, and easily checked. Also, the temperature can be recreated on consecutive days, so that doing the experiment over several days would not be a problem. Alternatively, the experiment could be completed all in one day. This would not only compensate for the changes in weather, and therefore temperature, it would also allow the possibility of any differences in the strength of hydrochloric acid and also sodium thiosulphate solutions that have been prepared for us to be declared irrelevant. The concentrations of these chemicals could differ slightly according to which batch they originated from, and this could affect the rate of the reaction.
The accuracy could be improved in a several ways. Wider containers would mean that the amount of solution would be ‘thinner’, and so it would take a considerable amount of precipitate until the cross was no longer visible, and vice versa. Therefore it is important that the width of the conical flask is maintained. Another way would be to change the method of the experiment completely. A light probe and data logger attached to a computer will give more accurate results than the human eye it would replace. It would act not only as an eye, but also a stop clock, measuring until there is zero light intensity getting through the solution. The downside to this method, however, is that the temperature of the bulb will eventually heat up the solution, and speed up the reaction.
To maintain the reliability of results, each reading was taken three times to allow for possible error, and the average taken to plot on a graph. Each result was accurate to ±0.1cm³, and was measured with the meniscus resting on the required measure. Each set of results was fairly similar, with the exception of the results taken at 30.0cm³ of sodium thiosulphate, which is discussed in due course. More readings may have given more accurate and reliable results, but would not have been very time efficient. That was the one downside to the burette. It was very accurate, but it took up more time then, perhaps, a measuring cylinder would have done.
Anomalous Results: -
There is but one example of an anomalous reading within my results. This s circled in green on my graph, with a dotted purple line showing why it is an anomaly, i.e. that it does not fit on the curve. I think that the honest possible explanation for this result is that the person measuring out the sodium thiosulphate and water failed to mark the burettes so as to distinguish what they contained. Subsequently, I believe it was at this point when she mixed the burettes up and had to rinse them out before starting again. I think that this anomaly is the result of this mix up, as maybe some residue remained in the burette, even after rinsing.
If there had been sufficient time, this result would have most certainly have been taken again.
The small red marks protruding from the points on my graph are attempted error bars. However, with the exception of the anomalous result, these were so absurdly small they are all but indiscernible.
Stability of conclusion.
Obviously, with more time, more readings would have been taken to form a more accurate curve on the graph. However, I believe that sufficient information was recorded to form a firm conclusion and to prove the aforementioned theory to be correct.
Bibliography: -
BBC bitesize revision (online).
Website entitled: - Collisional Theory Of Reaction Rates
The Learning Centre (online.)
Chemistry Textbook.