Ficks law explains the rate of diffusion: -
The rate of diffusion surface area x concentration difference
distance between the two areas
The duration the beetroot is in the water bath for; if the time varied then I may be investigating the effect of the time rather than the cause of the actual temperature change. Therefore I will keep each beetroot disc in the water bath for exactly 5 minutes.
I will use the same beetroot to ensure optimum membrane protein temperatures are invariable and the concentration and release rate of dye is regular to avoid erroneous results.
I will require the following apparatus for the experiment: -
- 5 boiling tubes.
- A test tube rack.
- 10ml of distilled water added to each test tube.
- Beetroot.
- Cork borer (size 5).
- Stop clock.
- Ruler.
- Thermometer.
- Razor blade.
- Cutting board.
- Curvettes.
- Water baths that are already set up in the laboratory.
- Pipette.
- Tripod.
- Gauze.
- Heatproof mat.
- Bunsen burner.
- Glass beaker.
- Colorimeter.
- Measuring cylinder.
- Primarily I will add 10ml of distilled water to a boiling tube using the measuring cylinder. I will then place the tube into the water bath and allow the water to reach the desired temperature.
- Meanwhile I will use the cork borer to extract a cylinder of beetroot, which will be cut into two 3mm discs using a razor blade.
- A thermometer is positioned in the water bath, and when the solution has acclimatised the discs will be deposited into the boiling tube.
- A stop clock is started and remains running for five minutes.
- The boiling tube is removed and placed in the test tube rack the solution is then transferred into a curvette via a pipette.
- A curvette containing distilled water is placed into the colorimeter to zero it. The transmission reading of the beetroot solution is then taken. The colour of the filter used for the determination is the colour that is complementary to that of the sample.
- For the 100°C reading a beaker of distilled water is heated on a tripod with the boiling tube inside, above a Bunsen burner. As above, the thermometer detects the temperature, the beetroot is added and the stop clock is timed for five minutes.
- The results will be recorded in a table.
- The experiment will continue until I have results for the range of water temperatures and an average will be taken.
Before conducting the official practical assessment I carried out preliminary experiments to determine whether the initial measurements would provide precise and accurate results for analysis and thus achieve a beneficial conclusion. I investigated different volumes of water and varied the number of discs I used. I found that 10ml of water gave a volume suitable enough to allow sufficient diffusion of anthocyanin molecules but prohibit too much dilution of the intensity of the pigment concentration. The number of discs added to the water remained the same, yet the thickness was changed from 3mm to 5mm, as cutting was easier, increasing the likelihood of them being equal size.
My prediction is that as the temperature increases so will the rate of reaction, thus releasing more dye. This is due to the kinetic theory which states as temperature increases, the kinetic energy of the substrate and enzyme molecules increases and so they move around faster and collide more often increasing the rate of reaction. However when the enzyme reaches its optimum temperature the rate of reaction will plateau as the membrane proteins are denatured.
Results: -
The table shows the percentage of light passing though the solution at different temperatures in all three experiments, and average has also been taken.
Conclusion: -
I have produced one graph that shows the averaged results, because individual experiments are not significant enough to come to a valid conclusion.
My prediction was correct, as the temperature of the water increased the more dye would diffuse out of the cell membrane and therefore the amount of light passing through the solution would be reduced. The graph shows is a curve, which demonstrates that the % of light decreases as the temperature increases. The first result is a slightly anomalous in relation to the rest, as the others are relatively close together, yet the pattern is still continued. The largest decrease in percentage of light able to diffuse through the solution was from 20 to 40 degrees, where the membrane would have broken down. From the graph I would estimate that the first result should have been about 58°C.
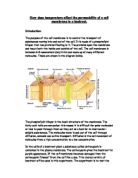
Red beet tissue contains large amounts of anthocyanin, a red pigment, located in the large internal membrane vacuoles. When the membrane is damaged, the pigment can cross the vacuole membrane and cell membrane. Since pigment is water-soluble and not lipid soluble, it remains in the vacuole when the cells are healthy. If the integrity of a membrane is disrupted, however, the contents of the vacuole will spill out into the surrounding environment. This usually means the cell that made the vacuole is dead.
However, at low temperatures such as 250C it is not possible that plant cell membranes are disrupted, even though pigment molecules do still move out of the membrane and into the solution. This is because facilitated diffusion is occurring, as facilitated diffusion occurs via permeases and protein channels, it would be expected that results would be similar to that of any enzyme graph. Membrane proteins carry out facilitated diffusion with similar properties to those of enzymes. Therefore, it is expect that as the temperature increases the more anthocyanin molecules are released from the membrane and into the solution. At low temperatures the molecules have little kinetic energy and collisions are few, so the rate of the reaction is slow, such as 20 and 250C. As the temperature rises the molecules have more energy, move faster and more collisions occur: the rate of the reaction increases.
However, at 45°C it is expected that the protein begins to denature, therefore the rate should decrease. 65°C is referred to as the death point of the cell, where the membrane and vacuole are disrupted completely. It is expected that at higher temperatures there will be a levelling off on a concentration against the temperature graph.
Evaluation: -
My results are quite accurate as I repeated all experiments. Working out the average so that my results were more reliable.
The graph shows one anomalous result, this being the first result and although it does fit in with the pattern of results it seems that slightly too much light passed through at that temperature.
There are many different reasons for why these anomalies may have occurred. One of these could have been that when the beetroot was cut into discs to be placed into the boiling tubes, the cell membrane of the beetroot may have been broken resulting in red pigment leaking out of it. This would have caused excess red pigment on the beetroot. I also didn’t wash excess pigment off each disc and I cannot assess the amount of pigment that was left on each disc. The excess pigment can easily get into the water in the boiling tube and as a result cause a higher reading on the colorimeter. Devising a method to reduce the amount of excess pigment produced would make results more accurate and reliable. Also another reason for the anomalies could be the fact that the beetroot pieces were cut out of different parts of the beetroot. This could mean that different parts of the beetroot could have more red pigment than others, resulting in those beetroot discs with more red pigment diffusing out more red pigment when heated. Making sure each beetroot disc was cut out of the same place in the beetroot would cause all of the beetroot discs to hopefully contain the same amount of red pigment to start off with.
If I were starting the experiment again I would conduct it on the same day so the beetroot would stay moist. I would also leave the beetroot discs in the solution for longer to allow a chance for further diffusion.
If I were extend my investigation I would add a pH buffer, as this accompanies temperature in making the enzymes work at their optimum. I would also use a smaller range of temperatures, starting with 10 to about 50, as my results don’t show a gradual break down of the membrane, it is more rapid.