PURPOSE: To gather and analyze experimental observations to determine the order of reaction with respect to the initial concentration of iodate ions in the iodine clock reaction.
MATERIALS:
-0.0522 mol/L potassium iodate solution (KIO3) (Solution A)
-0.0538 mol/L sodium bisulfite/starch solution (NaHSO3) (Solution B)
-distilled water
-3 plastic micropipettes (labeled A, B, H2O)
-3 100mL beakers (labeled A, B, H2O)
-2 spot plates (labeled A and B)
-stopwatch
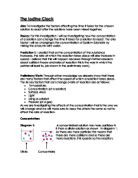
- The two spot plates were each placed on a white sheet of paper so that colour chage can be quickly identified
- Using the appropriate pipette labeled A, 10 drops of Solution A was placed in Well 1 of spot plate A, followed by 9 drops in Well 2, until 1 drop was placed in Well 10.
-
Again for spot plate A, 1 drop of distilled water was placed in Well 2, 2 drops in Well 3, and so on, till 9 drops were placed in Well 10. Thus each Well had a total volume of 10 drops in it, and each Well from 1 to 10 had a decreasing concentration of KIO3. Of course distilled water was used so as to prevent reactions that might have occurred between salts in regular water and the actual reactants of the reactions.
- In spot plate B, 10 drops of Solution B were placed in each well until 10 wells contained the Solution.
-
With the stop watch at hand, and using the pipette labeled H2O, the contents of spot plate A, Well 1 were transferred to Well 1 of spot plate B. The time taken for the change colour to occur was measured from the first drop of Solution A in Solution B to the first appearance of colour in new solution. The pipette was not allowed to touch Solution B so as to eliminate the need for rinsing it after each reaction.
-
Additionally, the contents of Well 2 of spot plate A were transferred to Well 2 of spot plate B and the time elapsed before colour change was evident was recorded. This process was continued until no visible traces of colour could be detected when different concentrations of Solution A were added to constant concentrations of Solution B.
OBSERVATIONS/ANALYSIS:
The reactions are:
-
IO3- + 3HSO3- → 3SO4 2- + 3H+ (slow)
-
5I- + IO3- + 6H+ → 3I2 + 3H2O (slow)
When all the Bisulfite is used up:
-
I2 + HSO3- + H2O → 2I- + SO4 2- + 3H+ (fast)
-
I2 + I- → I3- (fast)
-
I3- + starch → I3- starch complex (blue black)
Plotting a graph of 1/∆t vs. concentration of iodate ions yields the order for this reaction.
The Evidence suggests that the order of reaction with respect to [IO3-] is 1, since plotting the above stated graph yields a fairly straight line as opposed a curve. The regression value is also closest to 1 when a straight line of best fit is made.
Since rav 1/∆t
Therefore, if the rate of reaction in which iodate ions is consumed is
r av [IO3-] 1, then 1/∆t [IO3-] 1
As concentration of Iodate ions increase by a certain factor, so does the rate of reaction.
A part from the initial bisulfite ion concentration, other variables controlled in this reaction included temperature and chemical nature of reactants. The temperature of the environment remained fairly constant throughout the course of the experiment. However, in most reactions, the temperature of the system change as soon as the reaction begins. That factor is difficult to control. The chemical nature of reactants could not be altered during the experiment. Surface area played no part since the system had no boundaries. A catalyst was not used in this reaction. Hydrochloric acid, HCl was a suggested catalyst but it was not used as the reactants were very much capable of quickly reacting with aid.
CONCLUSION:
The order of reaction with respect to the initial concentration of iodate ions in iodine clock reaction is 1. This piece of information shows that for every increase in the concentration of iodate ions, the rate of reaction will not only increase as well, but increase by the same amount that the concentration of iodate ions increases. (i.e. if the concentration of iodate ions is doubled, the rate of reaction will also be doubled. Doing such investigations can be tedious, but the realization that the results are actually beneficial and reliable makes it worthwhile. In this reaction though, errors occur, but not so much that the results were not acceptable. Firstly, the concentration of reactants may have been inaccurate. It is important to add specific volumes of water to the wells for Solution A, so as to dilute the concentration, and yield a volume of 10 drops of solution in the well. The sizes of the water drops were not all equal, even though pipettes were cautiously picked so that all three looked about the same size. When transferring Solution A from spot plate A to B, the pipette might have accidentally touched Solution B. This would have thrown off the accuracy of the concentration of Solution A. As always, measuring short time intervals prove difficult and times may have been inexact. Nonetheless, the goal of the experiment was met. A dramatic colour change enabled us to investigate the effect of concentration on rate of reaction and figure out that when concentration of reactants and rate of reaction increase proportionally, the order of reaction is 1.