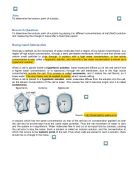
Procedure:
- Cut out 25 small cylinders of potato using the cork borer.
- Using a ruler make sure that the potato cylinders are of the same length. Cut the potato cylinders to the same length using a knife.
- Measure 50ml of each solution into five different beakers
- Label the beakers with a marker to know which beaker has which solution
- Using a marker, label each of the five potato cylinders (from numbers 1-5) that are to be placed in each beaker. Thus five different trials would be obtained for each concentration.
- Then measure the mass of each potato slice or cylinder using the digital balance. Record these values in a table.
- Place the five potato cylinders in each of the sodium chloride solutions
- Keep all the beakers in the same place, and leave them for about 24 hours.
- After this period of time, measure the mass of the potato cylinders again, and record all the values.
- Work out the difference in the mass of the potato cylinders before and after keeping them in the different solutions.
- Plot a graph using the average values of the change in mass and hence find the isotonic point of potato (where the change in mass is zero)
Fair test:
- The potato cylinders in each concentration should be of approximately the same length
- Cling film should be wrapped on the beakers to prevent evaporation.
- The potato cylinders should not directly be kept on the digital balance as they might be slightly wet. A tissue paper must first be used to wipe off the water from the potato cylinders.
- Make sure all test tubes are kept together so that the surrounding conditions are the same
- The same potato should be used for the experiment as different types of potato may have a different isotonic point
Results:
Qualitative observations:
Observations before placing the potato cylinders in the different solutions:
- All the potato cylinders look similar. This is obvious as they are cut from the same potato
- The potato cylinders are a bright yellow colour
- The texture of the cylinders is neither very rough nor very smooth.
- The potato pieces are moderately hard
Observations after placing the potato cylinders in different solutions:
0.1M -
- The potato cylinders looked slightly thicker and longer
- They were very hard and did not bend easily, showing an increased turgidity and rigidness
- The texture of the potato was quite smooth
- The colour of the potato changed from bright yellow to pale yellow.
0.2M –
- The potato cylinders looked slightly longer than before
- They were hard but not as much as those of 0.1M solution.
- They did not bend very easily.
- The colour was again a slightly lighter shade of yellow
0.3M –
- The potato cylinders were quite soft.
- They looked slightly smaller and shrunken then before
- The colour was a light yellow
- The potato cylinders could bend easily
0.4M –
- The potato cylinders looked very small and thin
- They were very soft as well, and seemed to be softer in the centre
- The colour of the potato cylinders had become very light yellow
- The potato could bend very easily
0.5M –
- The potato cylinders were very small and extremely thin
- They had become very soft and completely flaccid
- They could bend very easily and became very delicate, thus had to be held carefully
- The colour had become very pale, and the cylinders appeared slightly translucent.
- The cylinders seemed to be thinner from the centre.
Table showing change in mass and percentage change in mass of the potato for each trial of the different concentrations
Percentage change = (change in mass/mass before) * 100
Calculation of average percentage change in mass of the potato
Formula used: - Where x is the percentage change in mass; n is the number of trials and is the mean
Table showing calculations for standard deviation:
Standard deviation can be calculated using the following formula:
Formula used: where is the standard deviation, n is the number of trials and d2 is the square of the deviation. In this case the value of n = 5
Table showing calculation of standard deviation
Graph Analysis:
The graph shows the percentage change in mass for the different concentrations of the glucose solutions. The graph clearly shows an inverse relationship between the concentration of the solution and the change in mass.
With the concentration of 0.1M, there was a large increase in the mass, of about 19.5%. This shows that the solution was hypotonic and had a higher water potential than the potato cell. Hence water diffused into the cell. With higher concentrations of 0.2M and 0.3M, there was a lower increase in the mass (12.1% and 5.78%), showing that the solutions were less hypotonic. It is thus evident from the results that when the potato cylinder is in a hypotonic solution, there is endosmosis leading to increase in mass and turgidity.
As the concentration further increased, there was a negative change in the mass, or a percentage decrease in the mass of the potato. This shows that the solutions above 0.4M were hypertonic, or more concentrated than the potato cell. Hence water diffuses out of the potato cell, resulting in a fall in mass and turgidity. Thus it is evident that in a hypertonic solution, the potato cells lose water and exosmosis takes place resulting in the potato cells becoming flaccid.
From the graph one can see that the isotonic point of the potato was obtained as 0.33M. This is an isotonic concentration, where there is no net movement of water thus there is no change in the mass of the potato. This is the point where the line of best fit cuts the x- axis, as there is a 0% change in the mass of the potato.
It is also evident from the line of best fit that there are no major anomalies in the results, as most of values are close to the line of best fit. The standard deviation is also low for all the results, showing that the results were fairly precise.
Percentage error:
Literature value of isotonic point of potato = 0.25M (source -
Experimental value = 0.33M
% Error:
0.33-0.25/0.25 * 100 = 32%
Conclusion:
It can be concluded from the above results and graph that the isotonic point of potato from this experiment is 0.33 moles/dm3 with an error of ±32% (when compared to the literature value). This is the concentration where there is no net diffusion of water between the potato cylinders or the sodium chloride solution, as the concentration in the potato cells is equal to the concentration of the solution (0.33 moles as per these results). Since the concentrations are equal, there is no concentration gradient and thus even though water molecules move through the partially permeable membrane of the potato cells there is no net movement of water. At concentrations above the isotonic point of the potato, the concentration of sodium chloride inside the cells is lower than the concentration outside cells. As a result, there is a concentration gradient and thus water moves from a region of a high water potential to a region of low water potential. The effect is that water diffuses out of the potato cells, thus leading to a decrease in the mass of these cells. However at lower concentrations of the salt solution, the water potential outside the potato cells is greater than that inside the potato cells (which has a comparatively higher concentration of sodium chloride ions). Water thus diffuses into the potato cells down the concentration gradient, leading to an increase in the mass of the potato cells. Thus there is an inverse relationship between the concentration of the solution and the percentage increase in the mass of the potato cells – as the solution becomes more concentrated, the percentage increase in the mass of the potato significantly decreases as there is a change from net movement of water into the potato cells to net movement of water outside the potato cells.
Even though there were no major anomalies in the results, as a line of best fit could be obtained, there may have been some errors while conducting the experiment. These could have been random or systematic errors, and have been identified below:
Possible sources of error:
- The mass may not have been measured accurately as the air conditioner was on, which resulted in the continuous fluctuation of the reading on the balance. This would result in inaccurate recording of data and thus the difference in the mass of the potato calculated would not have been correct.
- The solutions were not left for exactly 24 hours. However all the solutions were left for the same period of time thus this should not have led to any major experimental errors.
- The beakers were left in open air and were not covered. Thus the solutions may have evaporated resulting in an increase in the concentration of the solutions. This could have led to major errors in the experimental results as the volume of the solution that evaporated from each beaker would not have been the same.
- The temperature or pressure were simply monitored and not regulated, hence a change in temperature or pressure would result in a change in the rate of diffusion, which would in turn affect the final mass.
- The surface area of the potato cylinders may not have been equal for all trials as the cork borer may have been pierced in the potato at different angles.
- If the potato pieces were not completely dried before weighing then the mass of the residual water on the surface of the pieces (which had not diffused into the potato) would be taken into account. Consequently this would increase the mass of the potato, thus resulting in errors in the results.
- Two different potatoes were used as the first potato was not enough to obtain 25 potato cylinders. As a result the isotonic points of both potatoes may have been slightly different.
Improvements to the experiment:
- The air conditioner and fans should have been switched off while taking readings of mass
- Instead to keeping the beakers out, they could have been kept inside a fridge. This would prevent evaporation of water. The beakers could also have been covered with cling film to prevent evaporation of the water. This would ensure that the concentration of the solutions remained constant, and thus the rate of diffusion would not get affected.
- In order to make the experiment more accurate, concentrations between 0.1M, 0.2M, 0.3M and 0.4M could have been taken, such as 0.15m, 0.25m etc. This would make it easier to find the exact isotonic point of the potato, and thus the experiment would have been much more accurate.
- One potato should have been used in order to maintain a fair test