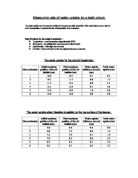
Measuring rate of water uptake by a leafy shoot.
The water uptake can be measured easily and because very high proportion of the water taken up by a stem is lost in transpiration, it enables the rate of transpiration to be measured.
Key Factors to be kept Constant: -
- Temperature – room temperature (approximately 25ºC)
- Wind speed – No artificial wind was produced to affect results
- Light intensity – Extra light was not used
- Humidity – it was not humid on the day experiments were conducted
The water uptake for the control Experiment.
The water uptake when Vaseline is applied on the top surface of the leaves.
The water uptake when Vaseline is applied on both surfaces of the leaves.
Gradient = m = Y1 – Y2
X1 – X2
CONTROL EXPERIMENT = M = 1.5 – 0.7 = 0.8 = 0.8
2 – 1 1
VASELINE ON UPPER SURFACE = M = 1.2 – 0.6 = 0.6 = 0.6
2 –1 1

VASELINE ON BOTH SURFACES = M = 0.8 – 0.4 = 0.4 = 0.4
2 – 1 1
The graph shows that the results received for each experiment is very consistent as the results are very close to the line of best fit. The graph represents the water uptake per minute. For all the conditions, the graph shows that the water uptake is increasing every minute. Although the graph illustrates that this is the trend for the results in each experiment, it also shows the variations between each experiments. ...
This is a preview of the whole essay
VASELINE ON BOTH SURFACES = M = 0.8 – 0.4 = 0.4 = 0.4
2 – 1 1
The graph shows that the results received for each experiment is very consistent as the results are very close to the line of best fit. The graph represents the water uptake per minute. For all the conditions, the graph shows that the water uptake is increasing every minute. Although the graph illustrates that this is the trend for the results in each experiment, it also shows the variations between each experiments. The graph shows that water uptake results were greater during normal conditions, the water uptake was slightly lower when Vaseline was applied on the upper surface of the leaf, and finally, the water uptake was the lowest when Vaseline was applied on both surfaces.
The conclusion that I can form from the graph and from having calculated the gradient is that under normal conditions without having altered factors such as temperature, light intensity, humidity, wind speed, the water uptake is really fast. The application of the Vaseline is very significant in affecting and altering the water uptake by making it slower than it otherwise would be. The addition of Vaseline is most affected when it is spread over the bottom of the leaf, hence, covering the stomata.
The reason why this occurred is because, when the experiments were conducted under normal conditions, there was nothing preventing transpiration. It happened as it does normally. The upper surface of the leaf has a layer of waxy cuticle, which reduces water loss. When I applied Vaseline on the upper surface it meant that the leaf now had two layers preventing water loss, so no doubt slightly reduced the water uptake. In the final experiment, where Vaseline was covered on both surfaces of the leaf, it considerably reduced transpiration therefore, the water uptake. This is because a very high proportion of water uptake is lost through transpiration.
Water is lost from the leaves, especially the bottom surface of the leaf. This is because on the bottom surface, it lacks waxy cuticle and usually has many more stomata. Stomata are pores surrounded by specialized cells (guard cells). These pores allow water to escape by diffusion into the air. As the water evaporates from the leaf by water evaporating from the surface of the parenchyma and escaping out through the stomata into the atmosphere, water from the xylem in the leaf replaces it. As water leaves the xylem, more is sucked up from below. A negative gradient in hydrostatic pressure forms, causing a column of water to rise up the plant. This is known as the transpiration pull. This means that transpiration directly affects the rate of water uptake. If this did not occur, the plant will wilt, and if water loss continues without being replaced, it will suffer plasmolysis. (Biology 1 text book and ‘Biology – AS in a week).
When both surfaces were covered with Vaseline, the Vaseline was applied over the stomata as well. By covering the stomata it meant that this would prevent water from escaping by diffusion, so this will reduce transpiration, which then led to a decrease in water uptake. The fact that both sides were now preventing any water from evaporating from the leaves of the plant means that this experiment had to have a lower water uptake, which it did.
The way in which water is transferred from the leaf to the atmosphere is through transpiration. A mesophyll layer, which is the middle of the leaf, is made of cells that are not tightly packed. This means that they are spaces between the cells is filled with air. The mesophyll walls are wet and some of the water from the mesophyll walls evaporates into these air spaces. This means that the air within the leaf is usually saturated with water vapour.
The air inside the spaces of the leaf has direct contact with the air outside the leaf due to the plant containing stomata (small pores). The potential gradient is significant because if there is a water potential gradient between the air within the leaf with the air outside the leaf, then this will result in the water vapour diffusing out of the leaf down this gradient.
If there is an increase in the water potential gradient between the air spaces in the leaf and the air outside the leaf, this will increase the rate of reaction.
Other forces which move water up the xylem are root pressure and cohesion. In root pressure, mineral ions are actively pumped into the pericycle cells around the xylem from the adjacent endodermal cells. This moves water into the xylem via osmosis and creates an upward force.
Cohesion (tension theory) is also another way water moves up a plant. Water molecules are polar and so both attract each other (cohesion) and are attracted to the walls of the xylem (adhesion). These forces draw up water.
T-tests
T-tests compare exactly two groups
Results of T Test 1
This shows the T-test results between the Control tests with the results from the experiment with Vaseline on both surfaces of the leaves.
Results of T Test 2
This shows the T-test results between the Control tests with the results from the experiment with Vaseline on the upper surface of the leaves.
Results of T Test 3
This shows the T-test results between the results from the experiment with Vaseline on both sides of the leaves with the results from the experiment with Vaseline on the upper surface of the leaves.
For all three T-tests, the pattern that is similar is that the probabilities are all below the critical value, which is 0.05. This means that I can reject the “null” hypothesis that there is no difference between the means for each T-test and that the results only occurred by chance. I can assume that there is a significant difference between the means and the difference is real.
There is not a big difference between each individual reading either which means that my results must be quite accurate.
From the tests I can also see that the mean for the control test is greatest (0.8000), then the mean for the experiment with Vaseline on top (0.6167) and the lowest mean was for the experiment with Vaseline on both sides (0.4500).
The standard deviation also shows this trend 0.1095 for the control, 0.0753 for the Vaseline on top, and 0.0548 for the one with Vaseline on both surfaces. The variance also supported this, 0.0120 for the control experiment, 0.0057 for the Vaseline on top, and 0.0030 for the one with Vaseline on both sides. The results from the T-tests support the trend showed by the graph, and this is supported by the background information.