Evaluating Evidence
My results
My results, I thought were quite accurate as they showed a good fit to what I expected. They were all right and there were no odds results apart from one. This could have been from not being in long enough still or not enough solution in etc, anything that will affect the variables in anyway. Another reason why I thought our results were accurate was because we used a wide range of sugar solutions ranging from 0M to 1M. This would have made the results more spread out and easier to see any changes in it all.
The method
I think the method was suitable as we got a good set of results without any problems occurring during the experiment. I don’t think there were many improvements to be made, only just to keep the experiment going on longer. At the end of it all we got good enough results to explain what changes there are through osmosis in different strengths of sugar solution.
Osmosis Coursework
Introduction:
Osmosis is the passive diffusion of water through a selectively or partially permeable membrane. The water moves from a region of high water concentration (a dilute solution) to a region of a lower concentration (a concentrated solution). The partially permeable or selectively permeable membrane, which can be a living or non-living, allows water molecules to pass through. Osmosis is a slow process in which only water is transported. It only takes place in a short distance but the cell does not have to use up any energy for it to take place.
Water molecules move randomly, and when water is enclosed by a membrane, living or artificial, some of the moving water molecules will hit the membrane, exerting pressure on it. This pressure is known as water potential. As the number of water molecules increases, the number of collisions between the molecules and the surrounding membrane increases so the water potential will increase. Water potential is represented by the symbol Ψ (Greek letter, “psi”). It is measured in units of pressure, kilopascals (kPa). Pure water has the highest water potential and by convention has a water potential of zero. A solution with a lower concentration of water molecules will have a negative water potential.
Different concentrations of solute molecules lead to different concentrations of free water molecules on either side of the membrane. On the side of the membrane with the higher water concentration, more water molecules will strike the pores in the membrane in a given interval time. More strikes equate to more molecules passing through the pores, which in turn results in net diffusion of water from the compartment with high concentration of water to that with low concentration of water.
In osmosis, water flows in a response to differences in molarity across a membrane. The size of the solute particles does not influence osmosis. Equilibrium is reached once sufficient water has moved to equalize the solute concentration on both sides of the membrane, and at that point, net flow of water ceases. Here is a simple example to illustrate these principles:
Osmosis in plants:
In plant cells, there are two cell barriers, wholly permeable cell wall and partially permeable cell surface membrane. In A the entry of water into the vacuole by osmosis causes an increase in cell volume and turger pressure which is opposed by the cell wall pressure. In B the loss of water from the vacuole by osmosis causes a decrease in cell volume and withdrawal of the cell surface membrane from the cell wall. This is referred to as plasmolysis.
Aim:
My aim is to investigate and find out the value of water potential inside of a potato using different concentrations of sucrose solution.
Prediction:
Potatoes are plants and they have a general plant structure. It will contain a plasma membrane which will be selectively permeable, allowing water and some solutes though except larger solutes and ions. For this reason I predict that if the potato tubes are placed in a solution containing a higher water potential than its own cells, there will be a net movement of water from the sucrose solution with the higher water potential into the potato cells due to osmosis and as a result, varying the mass and the size of the potato tubes. I also predict that the longer the potatoes are left in the solution, the bigger the increase in the change of mass in the potato chips. This is because there is more time for osmosis to take place.
Plan:
My plan is to devise an experiment so I can achieve my aim of finding out the value of the water potential inside of a potato using different concentrations of sucrose solutions. I will be required to make up a stock solution of 1 M sucrose. I will prepare a wide range of sucrose solutions and put them into test tubes, where I will also put the potato chips, and I will then record the readings which I need.
I will first do a preliminary experiment using a different range of sucrose solutions to give me a wide range of readings. After conducting my preliminary experiment I will then be able to decide a narrower range of sucrose solutions which I can use for my actual experiment. From this I can then work out the water potential inside of a potato chip.
Variables:
There are many variables that can affect my experiment of determining the water potential of the potato tubes either directly or indirectly. The variables that can affect my experiment are:
- Size of potato tubes
- Temperature of the sucrose solution
- Time that the potato tubes are left in the sucrose solution
- Surface area of the potato tubes
- Age of the potato
- Concentration of sucrose solution
- Type of solution
All the variables listed above can affect my experiment; however the variable I have selected to investigate is the concentration of the sucrose solution. All other variables will be kept constant, to maintain a fair test.
It is important to change the concentration of the sucrose solution so I can then work out the water potential inside of the potato.
1. Size
I will keep the size of the potato chips around the same range, which is between 4-5cm. size affects the osmosis and the rate of how it occurs. If the size of the potato chip were quite small, there would be a smaller surface area for osmosis to occur and it would take longer for the concentration of the solutes inside the potato cell and in the solution to become equal (isotonic).
2. Temperature
I will keep this the same throughout the experiment by not heating up any of the sucrose solution, water of the potato chips. Although if I were to increase the temperature of the sucrose solution the water molecules would move faster and therefore increase the rate of osmosis due to their being more kinetic energy in the particles.
3. Time
I will also keep this variable constant. Time is a very important factor as it takes time for molecules to reach the iso-osmotic point. If the potato chips were submerged in the sucrose solution for a small amount of time, the change in mass and length would be low and also, if the potato chips were submerged in solution for a long time, the change in mass and length would be far greater because the water molecules had a lot longer to move for osmosis.
4. Surface Area
The surface area of the potato tubes would be kept constant throughout my experiment by using a cork borer to cut through all the potatoes. The potatoes would be in a cylindrical form.
5. Age
The age of the potatoes could affect osmosis as the older the potatoes are, the longer osmosis will take place, although if the potatoes are newer osmosis will take place quicker.
6. Type of Solution
I will keep this constant by using sucrose throughout the experiment. The sucrose is not involved in osmosis by movement through a selectively permeable membrane, although it does alter the rate at which water moves through the membrane and its potential and therefore known and solute potential.
7. Concentration
As the concentration of sucrose is very important in determining the water potential of the potato tubes, I will use a wide variety of concentrations in my preliminary experiment to find out where the iso-osmotic point is, and then in a more detailed experiment I will use more specific concentrations of sucrose in order to find the concentration of sucrose inside of the potato tubes. To find out the concentration of the potato tubes there should be no percentage change in mass and length of the tubes as osmosis will not occur. I will then convert this value into water potential using a graph which I will create.
Apparatus:
- volumetric flask
- 10cm3 pipette
- 1cm3 pipette
- distilled water
- granulated sugar
- test tubes
- potatoes
- cork borer
- knife
- beakers
- electric scales
- spatula
- stopwatch
Safety:
- Care should be taken when using the knife to cut the potatoes to size and to avoid injury, it should be used appropriately to avoid cutting fingers
- The cork borer is another sharp piece of apparatus and care should be taken as this is forced into the potatoes.
- Glass equipment such as test tubes and pipettes should be used with caution as if an accident occurs, it should be reported immediately.
Method:
- First of all, I worked out that I needed 250cm³ of 1M sucrose solution and to get this, I knew that the relative molecular mass of sucrose was 342.3g. Although this was to make one litre (1000 cm³) of 1M sucrose solution and I only needed 250cm.
- So I only needed ¼ of 342.3 grams which worked out to be 85.575 grams of sucrose.
- The scale which I used only measured up to two decimal places so I rounded my figure up to 85.58g.
- I put a beaker on the scales and pressed the ‘On’ button, now the scale did not include the weight of the beaker and so now, I started to add granulated sugar into the beaker until I got exactly 85.58g.
- Once I got the amount of sugar which I needed, I slowly started to add in distilled water and started to mix it.
- I wanted the sucrose completely in solution and also using as little distilled water as possible.
- As the sucrose solution started to become clear, I knew that it was going into solution. Once it was completely in solution, I transferred this into a volumetric flask which measured out exactly 250cm³.
- Because I only used a minimum amount of water to dissolve the sucrose, there was still some more needed to be added in the volumetric flask, and so I filled up the remaining space with dissolved water using a pipette up to 250cm³.
- A pipette is an instrument, which very accurately allows me to measure different amount of solutions.
- Once this solution was all ready, I had to make sure that the bottom of the meniscus of the sucrose solution touched the 250cm mark on the volumetric flask.
- Once I had prepared this I then had prepare the solutions of sucrose concentration, for my preliminary experiment the concentrations I used were 1.00M, 0.75M, 0.50M, 0.25M and 0.00M.
Preliminary experiment:
I have carried out a preliminary experiment using five varied concentrations of sucrose solutions. The different concentrations that I have used are 0.00M, 0.25M, 0.50M, 0.75M and 1.00M. I will measure the length and the mass of the potato chips after every 30 minutes, I will do this for 2 hours, and therefore I will have four sets of results. I carried out this experiment and have obtained results and plotted these onto a graph. I will use more specific concentrations of sucrose to get an exact answer for the iso-osmotic point which I will then convert into water potential which will be my final answer.
After doing this preliminary experiment, I have noticed all the possible errors that I could have made such as not measuring all solutions from the bottom of the meniscus and not cutting the potato tubes straight as this would affect osmosis. I will try to avoid all of these errors and more whilst doing my main experiment and to use the equipment correctly for accuracy.
I never repeated any readings for this preliminary experiment as it was only a trail experiment for me to fully understand what I was doing, get used to all the equipment which I was going to use and finally to find out what concentrations of sucrose solution will be needed for my main experiment.
Results:
After 30 minutes:
After 60 minutes:
After 90 minutes:
After 120 minutes:
Overall change in length and mass:
- Therefore I decided that I would use concentration of sucrose solution for my detailed experiment to be: 0.25M, 0.29M, 0.33M, 0.35M, 0.38M and 0.40M
- For my detailed experiment I decided to replicate the experiment, so I could ensure that my results are reliable and to eliminate any errors which I could have possibly made.
- I set up two test tube racks both containing 6 test tubes each and set up the solutions again.
- After all the solutions were prepared, I then took a fresh potato and using a cork borer; I made a hole through the potato and took the chip out. I cut 12 pieces of chips, half of them for my replicate experiment. I then placed each of the potato chips into the sucrose solution.
- I decided to leave the potato chips in the sucrose solution for 2 hours, so there was enough time for osmosis to take place.
- After two hours, I took out the potato chips, one by one, so there was no mix-up between them, I blotted each chip dry, as I did not want the scales to measure the mass of the solutions which the chips were in.
- I then recorded both the mass and length of the potato chips, giving me two sets of results. After I had done this I was then able to plot these results onto a graph.
Actual Experiment Results:
* indicates repeat readings
Conclusion:
Figure 2 shows the plot percentage change in mass in grams of potato tubes against the sucrose concentration. The readings from the experiment are represented by the green crosses, and the repeat readings are represented by the red crosses. Repeat readings were done to verify the original readings to obtain a reliable average value. From my results I can see that the iso-osmotic point on the graph lies around 0.35M, this is when there is no net movement of water molecules and therefore there is no increase or decrease in mass. This is the pressure that is exerted on the cell walls of the potato cells from the water molecules.
Evaluation:
After recording the results of my preliminary experiment I found a few anomalous readings. Firstly in figure 2, on the graph I can see that the results of 1.00M and 0.75 fitted in with my prediction, the longer the time for osmosis to take place, the bigger the increase in the change of mass. However for 0.50M after 60 minutes the rate of osmosis decreased slight and then after 90 minutes increased again. This could be due to a number of reasons; one possible reason is that I made an error whilst conducting the experiment. For my actual experiment I did not measure the length of the potato chips, this is because after measuring the length in the preliminary experiment and plotting the results, I could see that the results were not accurate and not easily measurable. The mass scale produced a much accurate reading of the rate of osmosis; therefore I decided to only measure the change of the mass.
Throughout the experiment errors were always occurring because everything which I did contained a slight risk of error and some of the errors are bigger than others and they could also build up to create a large percentage error.
When we used measuring cylinders and pipettes, there was a risk of error as we had to make sure that all solutions were measured from the bottom of the meniscus. Also, when the liquids were transferred for example from the pipette to the test tubes, there was still some liquid left in the pipette. This is an error although it is not a big one.
Also, when I had to cut the potatoes tubes to size, sometimes they were cut slightly bent and I had to make sure that they were perfect although I did not have time for making sure that they all were perfect so therefore this is another source of error. This error could be quite big as it affects the rate of osmosis.
When I had to dry the potatoes using blotting paper, some of them might have received more drying than others and this could be a big error as it affects that mass of the potatoes and this can affect the iso-osmotic point, and where it lies on the graph.
When I used a cork borer to cut out a potato tube, some of the potatoes could have still had a little skin left on it or there may have been a dent on the surface. This could have affected the rate of osmosis and therefore contribute as quite a large error.
I used the best equipment that was available to me to the best of my ability to obtain good accuracy in the investigation. I made sure that all of the solutions which were measured using the pipette were from the bottom of the meniscus. I also made sure that every reading I took from the electric scales, that there was no water on it to reduce error and most importantly to increase accuracy to ensure that all of my results were consistent. I also made sure that my cutting of the potato tubes was straight as I had a lot of practice in my preliminary experiment.
The main reason which I could think of there being the anomalous result in my investigation is that I could have accidentally put in the wrong amount of solution into the test tube.
A method of improving my experiment is by using more electrical accurate machines. I think that using an electrical machine to cut out the potato tubes to their exact size would have been good as it would have saved me time and there would have been a reduced possibility of error in my investigation.
I believe that my results were reliable because on figure 2, it shows two graphs, one of the original and the other the replicate to be very close to each other and crossing one another many times.
Osmosis – The Movement of Water
Hannah Gray
Mrs Lotz
10D
15/5/07
Osmosis – The Movement of Water
Date: 15/5/07
Name of Partners: Lara and Lisa
Aim: To observe the effects of the movement of water into and out of cells.
Materials:
- Fresh potato
- Distilled water
- Salt (sodium chloride) solution (20%)
- 2 small beaker or jars
Procedure: As per page 40 of Science World 3
Results:
Diagram 1:
Equipment Set-up
Discussion
a) Summary: Two cubes of potato were placed in two different beakers. One beaker contained salt water, the other contained distilled water. These two beakers were left overnight and the next day the results were observed and recorded. The results were, the cube of potato that was in the salt water became small and soft (flaccid) and the cube of potato that was in the distilled water became hard, firm and larger (turgid).
b) Analysis: Osmosis is the reason that the potato cubes changed in texture when put in different solutions of water. The definition of osmosis is the movement of water through a semi permeable membrane from a region of high water concentration to a region of low water concentration. Therefore, in the case of the distilled water, because potato cubes contain approximately 90% water, and the distilled water is 100%, the water molecules diffused into the cell, making it turgid. In the case of the salt water, because there is a high concentration of water in the potato and a low concentration of water outside of the potato, the water in the potato diffuses out of the cells and through the semi permeable cell membrane, making the cell flaccid.
c) Evaluation: The results we obtained supported the theory of osmosis. There were no anomalies in this experiment. This experiment was well designed and cannot be improved.
d) Conclusion: In conclusion, the diffusion of water into potato cells and therefore making them hard was observed, and water diffusing out of potato cells and making them soft was also observed. The aim was achieved, the effects of the movement of water into and out of cells were observed. Mangroves are just one plant species that has to deal with osmosis. Considering the fact that they live in salt water, they have developed a way in which to limit the amount of water they lose. Mangroves take in salt water and then their leaves excrete salt crystals, leaving them filled with pure freshwater.
Biology coursework: investigating osmosis in potato cells.
Aim: what happens when potato cells are placed in different concentrations of sugar solution?
Introduction: what is osmosis?
We know that osmosis will take place in this experiment because; osmosis is the transfer of a liquid solvent through a semi-permeable membrane that does not allow dissolved solids (solutes) to pass. Osmosis refers only to transfer of a solvent; transfer of solute is called . For example a higher concentration can be transferred to a lower concentration.
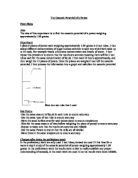
Osmosis is a special case of diffusion-movement of water across a semi-permeable membrane. We can observe this if we put potato chips in different concentrations of sugar solution, depending on the concentration of sugar in the solution, and whether there is more water available inside or outside the potato, water will either move into the potato chip, out of the potato chip, or neither.
There are three glass beakers-one with too much sugar 20%, one with only sugar 0%, the last with equal amounts of both 10%. In the semi-preamble membrane there are invisible holes for sugar solution to go in and out of. As you add more sugar solution, the chip begins to shrivel up because there is no room for any more sugar to get in.
Prediction:
I predict that: the chip that is in the solution with the higher concentration (25%) will shrivel up because there is too much sugar. The chip which is in the solution with the lower concentration will get fatter because there is more room for the solution to get in. Not all the chips will gain or lose weight.
Independent/dependant variables:
- An independent variable
- A Dependant variable
My independent variable is the concentration of solution- I am going to be giving it 5 values and the values are 5%, 10%, 15%, 20% and 25%. To make it reliable I will be repeating the experiment 3 times to make sure my results are correct and it wasn’t a fluke. More then one group of people will do the exact same experiment: same length of chips, time, 40ml solution etc. To get this done quickly I could ask many people to do this experiment to get it done faster.
The dependent variable is to measure/observe the weight or length or width. We will be measuring these before and after testing the chips. This is a good thing to measure because, it will definitely change from the time you put the chip in the solution and the time you take it out of the solution-it would have either got smaller, fatter, shorter, thinner etc. this will be measured with a ruler.
The control variables are:
- The temperature for all test tubes/beakers must stay the same (room temperature). If 1 was warmer, osmosis would happen quicker. So, we have to keep the rate of osmosis the same.
- The time the chip is in the solution-you couldn’t have different times because each chip has to stay in the solution for the same amount of time to get fair results. I will use a stop clock to keep the time
- The type of potato-you couldn’t change the type of chip because it wouldn’t be fair, one chip could absorb more solution then others. Also the length of the chip has to stay the same. A potato cutter must be used too and must be cut to 5cm and measured with a ruler because, some chips have a larger surface area means that osmosis can happen more effectively.
- The concentration of the solution-this would have to be controlled to make sure the chip is fully covered.
- The length of the chips-they would have to stay the same in order to get similar results length wise.
- The volume of the sugar solution-they volume should be kept the same to make it fair. 40ml in all experiments, it will be measured with a measuring cylinder.
These variables will be kept the same to make it a fair test.
To make sure that my results are reliable by having repeat readings, this will rule out chance or mistake readings. In order to do this, you could have more then just one person doing the experiment at the same time.
Apparatus:
- Test tubes (x3)
- Test tube rack
- Scalpel (blade)
- White tile
- 3 potato sticks (chips)
- Measuring cylinder
- Glass beakers (containing sugar solutions)
- Ruler
- Paper towels
- Cork borer
- Wash bottle
- Top hand balancers
Diagram:
Method:
Firstly I will be getting my equipment and labelling the test tubes 5%, 10%, 15%, 20% and 25%. Next I will be measuring the solution out (40ml) and pour it into the test tubes. After this I’ll put the test tubes in a water bath for osmosis to happen. After an hour, I will take them out of the water bath and dab the excess water off the chips and measure the length of them and the width then take down my results.
Safety Precautions:
I think that in this experiment, safety goggles and aprons should be worn at all times.
Analysis:
When the chips were taken out of the distilled water some of them looked fatter then others, some stayed the same and some looked thinner. This is because osmosis has occurred. The chips from concentrated solutions are quite fatter then the others, but some aren’t, some are the same size and some are smaller and more shrivelled up, these ones appeared to be more bendy and thinner.
The weights of the potatoes that were soaked in the diluted sugar solutions are considerably higher when they came out then when they went into the solution. For example, the first chip went in weighing 1.55g and came out weighing 1.88g. The solution made it gain 33g. The potatoes in the stronger sugar solutions decreased in weight. This happened because, the higher the solution, the faster the rate osmosis will happen. The overall average mass of the chip at the end was lower then it was going into the solution. In my investigation, I noticed there was a pattern, as the concentration got higher, the mass got lower. At 0% the mass was 1.80g and at 25% the mass was 1.23, also the differences in mass were extremely different. At 0% the difference in mass was 0.35 and at 25% the difference was -0.26.
In conclusion, the variables in my graph are show a great difference. The percentage in mass doesn’t seem very high, but, the percentage of sugar solution seems quite low too. The graph is even, there are three points under the line and three points over the line. The cross over point in my graph shows that osmosis happened most effectively at 15% (half way). I predicted that the chips in the higher concentrations would not get fatter, but they would shrivel up because there was a ‘sugar overload’ and this was proved right in my experiment. Also my predictions were correct because the chips in the lower concentrations got fatter.
Evaluating evidence:
I think that the method I used was effective and good to use because it is quick and reliable if you have more then one person doing it at a time. The equipment I used was also reliable, nothing broke down half way through and everything was measured accurately. I think that my results show that there is a clear link between the variables because, in my results table you can see each of the chips (1, 2 and 3) results are quite similar and the numbers are very close, it’s the same when they are taken out of the solution an hour later. This shows that my results are accurate and very good for plotting graphs and showing osmosis. They show a pattern which, in my graph holds a perfect line of best fit.
To ensure my results were I made sure that, I used the most of the accurate equipment available for example: carefully measuring out the solutions and making sure that all the potatoes are cut to the same length and width. There were no anomalous results because there is the line of best fit in my graph, this shows that all my results are accurate. I think that if we were to use ready cut potatoes and if we could but sugar solutions which were already poured out to 0%, 5%, 10% etc to save us some time, and we could trust that they would definitely be the right amounts. I think that the equipment I used was very accurate because I got such good results, I don’t think id change them. The whole class did the experiment, so yes, I had repeats. We then compared results and used the best ones to make are graphs and results tables to go into the coursework. This worked very well because, the graph I have produced seems to work very well and show just how accurate the experiment worked. I didn’t have any anomalous results because; the experiment was carefully planned out and I took time to double check I had done every thing correctly before putting my test tubes into the water bath. I think my results are reliable because they make a perfect graph, from my graph you can clearly see that osmosis has taken place in these chips. I think that maybe there could have been more points on my graph to make it even more reliable. To make more points, we could do more sugar concentrations. For example: instead of stopping at 25%, we could make the experiment go on for 30%, 40% etc. I think that there isn’t enough range in my graph to be sure about the pattern shown, but again, if there was more points added, then yes there would be a clear pattern.
Osmosis Investigation
Background Information
Osmosis is the passive diffusion of water through a selectively or partially permeable membrane. The water moves from a region of high water concentration (a dilute solution) to a region of a lower concentration (a concentrated solution). The partially permeable or selectively permeable membrane, which can be a living or non-living, allows water molecules to pass through. Osmosis is a slow process in which only water is transported. It only takes place in a short distance but the cell does not have to use up any energy for it to take place – therefore it is an example of passive transport as it does not require energy.
Water Potential
Water molecules move randomly, and when water is enclosed by a membrane, living or artificial, some of the moving water molecules will hit the membrane, exerting pressure on it. This pressure is known as water potential.
As the number of water molecules increases, the number of collisions between the molecules and the surrounding membrane increases so the water potential will increase. Water potential is represented by the symbol Ψ (Greek letter, “psi”). It is measured in units of pressure, kilopascals (kPa). Pure water has the highest water potential and has a water potential of zero. A solution with a lower concentration of water molecules will have a negative water potential.
Different concentrations of solute molecules lead to different concentrations of free water molecules on either side of the membrane. On the side of the membrane with the higher water concentration, more water molecules will strike the pores in the membrane in a given time. More strikes result to more molecules passing through the pores, which in turn results in net diffusion of water from the compartment with high concentration of water to that with low concentration of water.
In osmosis, water flows in a response to differences in molarity across a membrane. The size of the solute particles does not influence osmosis. Equilibrium is reached once sufficient water has moved to equalize the solute concentration on both sides of the membrane, and at that point, net flow of water ceases. Here is a simple example to illustrate these principles:
Aim
To find out how the concentration of the sugar solutions affects the amount of water intake by potatoes.
Equipment
Beakers
Measuring Cylinders
6 sugar solutions of different concentrations ranging from 0.0-0.5%
Weighing machine to 2 decimal places
Hypothesis
Potatoes are plants and they have a general plant structure. It contains a plasma membrane which will is selectively permeable, allowing water and some solutes though except larger solutes and ions. I predict that the potato piece with the lowest concentration will take in the most water through osmosis. This is because the solution is dilute and there is less water in the potato and therefore there will be a net water movement from the solution to the potato. As the solution is dilute the water potential is at its highest. I also predict that the potato with the highest concentrated solution will absorb the least amount of water as there is a smaller net movement from the solution to the potato. This is because the solution contains less water and more sugar and therefore there will be less water movement from the solution to the potato resulting in the potato piece with the lowest mass. This is because there is a low water potential.
Results