Photosynthesis Lab
Jillian Wilson
Framingham State College
March 29th, 2002
Introduction
Photosynthesis is a very important process. It uses sunlight, Carbon dioxide, and water to make food, and gain energy. The process occurs in three stages: the capturing on energy from sunlight, the formation of ATP (from that energy), and the synthesis of CO2 (by use of ATP). The equation for photosynthesis can be written as:
6CO2 + 12 H2O + light energy --> C6h1206 + 6O2 + 6H2O
But why is it important?
By releasing oxygen and consuming carbon dioxide, photosynthesis has transformed the world into the hospitable environment we know today. Both directly and indirectly, photosynthesis fills all of our food requirements and many of our needs for fiber and building materials. The energy stored in petroleum, natural gas and coal all came from the sun via photosynthesis, as does the energy in firewood, which is a major fuel in many parts of the world. This being the case, scientific research into photosynthesis is vitally important.
In this lab, we studied the effects of light intensity on photosynthetic rate, and the relationship between color (essentially light wavelength) and photosynthetic rate. This was an interesting process as it involved the measuring of bubbles released from a plant under water, thus determining the rate of photosynthesis by the amount of oxygen released. The colors used in the experiment were red, blue, and green, which one might suspect, in that order, to result in consecutively less releasing of oxygen. In regards to this experiment, this is shown to be only partly true. The experiment also helps to confirm ideas that greater light intensity will result in a faster photosynthetic rate, as the plant is able to capture the energy more quickly from the brighter light.
We also studied the interesting techniques of chromatography in this lab. Chromatography is a widely used method to separate, detect and quantify organic chemicals. The procedure relies on the capillary action as the separating mechanism. There are several types of chromatography including paper, packed column and thin tube. In paper chromatography, the different substances are separated, and each travels up the paper at a different rate, with the rate being determined by the solubility of each substance.
In our lab, we used the techniques of paper chromatography to obtain both chlorophyll A and B, and their accessory pigments via the chloroplast pigment of a spinach leaf.
This was really very neat, and we were able to watch the pigments separate, forming a slightly greenish rainbow, as well as learn about the distance traveled by the substance and its meanings. However, the processes of paper chromatography lead to another study in our lab. This was the study of differential absorption of light by various pigments in plant material.
In the photosynthetic process, pigments are very important. They absorb light energy and enable it to be converted into chemical energy, which is used by the plants to make glucose and oxygen from carbon dioxide and ...
This is a preview of the whole essay
This was really very neat, and we were able to watch the pigments separate, forming a slightly greenish rainbow, as well as learn about the distance traveled by the substance and its meanings. However, the processes of paper chromatography lead to another study in our lab. This was the study of differential absorption of light by various pigments in plant material.
In the photosynthetic process, pigments are very important. They absorb light energy and enable it to be converted into chemical energy, which is used by the plants to make glucose and oxygen from carbon dioxide and water. Plants appear to be different colors because of the dominant pigments they contain. These pigments absorb some colors of light and reflect others, for example, the green chlorophylls absorb light from the blue-violet and the red regions of the visible spectrum and reflect green light. This is why plants, which contain mostly chlorophylls, appear green. Other pigments found in green plants, the yellow, orange and red carotenoids that absorb light only from the blue-violet region of the spectrum, are mostly masked by the more dominant chlorophyll.
In our lab, we chose to study the absorption spectrum of chlorophyll. We used the pigments chlorophyll a and chlorophyll b. The data collected from this experiment will correlate with other tests done on chlorophylls a and b.
Methods
Chromatography: Separation of Chloroplast Pigments from Spinach Leaves
After cutting strips of 2cm wide filer paper proportionate to the size of test tube, we took one strip, and trimmed one endpoint with scissors. We then lay the cut strip of filter paper on a clean strip of regular paper, preventing contact with other substances. We attached the paper to a card pin/cork apparatus, with the blunt end in the card pin, and inserted the paper into a large test tube. The test tube was then marked for depth, and only the tip of the filter paper was allowed to be in contact with the solvent. After testing for depth and appropriateness of tip point, we removed the cork apparatus and poured in the required amount of chromatographic solution.
We took a solution of ground spinach leaves in 5 ml of acetone (the chlorophyll extract), and, using an eyedropper, applied a narrow strip of the extract approximately 2-3cm from the pointed end of the filter paper. The paper was allowed to dry thoroughly before adding the next layer, and six layers of chlorophyll extract were put on the paper.
The cork/paper apparatus was then put into the test tube containing the solvent.
After about 30 minutes, the solvent front was near the top of the strip, and we removed the strip, and made a pencil mark (allowing the location of the solvent front). We then let the chromatogram dry. When dry, we outlined the individual substances with a pencil.
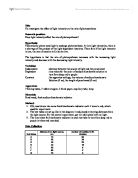
Effect of Light Intensity on Photosynthetic Rate
We first filled a test tube with 0.5% NaHCO3. After doing so, we obtained a healthy green sprig of water plant Cabomba, and with a razor blade, made a diagonal cut acroos the stem about 6-8cm from the growing tip. The sprig was quickly placed in a test tube so that the cut end is up and about 3 cm from the top of the tube. Filling the wide-mouth jar containing the plastic form with water, we placed the tube containing the Cabomba and sodium bicarbonate in the plastic holder. The apparatus was placed about 30 cm from a lamp with a 75-Watt bulb. We then turned the lamp on, and when bubbles of oxygen began to regularly emerge from the cut stem, we began timing the number of bubbles produced in a 3-minutes interval. This was repeated for another 3-minute interval and the average of the two was then calculated.
We repeated this experiment with a 150-Watt bulb and a 300-Watt bulb, draining the sodium bicarbonate solution in the test tube and refilling with a fresh 0.5% NaHCO3 each time.
We also repeated the experiment three more times using the 300-Watt bulb, and masked it with a shield of blue, then green, and then red. We did not change the sodium bicarbonate between colors, and only measured each color for one set of 3 minutes.
Absorption Spectrum of Chlorophyll
In this part of the lab, we cut out the blue-green band of chlorophyll a from our chromatograms and placed them in a test tube. We added 10 ml of acetone and mixed it with a glass rod. Pouring off the extracted pigment into a clean cuvette, we filled another cuvette with acetone alone and used this tube as a blank. Using the Bausch & Lomb Spectronic 20 spectrophotometer, we determined the absorption spectrum of chlorophyll a, at the absorbencies 380 to 700 nanometers, at 20 nm intervals and recorded the data in tabular form.
The same procedure was used using the yellow-green band of chlorophyll b from our chromatographs.
Results
Chromatography: Separation of Chloroplast Pigments from Spinach Leaves
The distance traveled by each substance was measured and compared with the distance the solvent traveled. The Rf value was equal to:
Rf=distance traveled by substance cm/distance traveled by solvent cm
Carotene: Rf=16cm/16cm
Rf=1
Xanthophyll: Rf=13.5cm/16cm
Rf=0.843
Chlorophyll a: Rf=12.75cm/16cm
Rf=0.796
Chlorophyll b: Rf=1cm/16cm
Rf=0.625
Effect of Light Intensity on Photosynthetic Rate
In the first three minutes, the number of bubbles was usually less than the number of bubbles during the second three minutes. Comparing averages, the 75-Watt bulb had the lowest photosynthetic rate, the 300-Watt the highest photosynthetic rate, and the 150-Watt, though substantially greater than the 75-Watt bulb was left in the middle.
Graphical illustrations of this are on pages 8,9.
The color of light effect photosynthetic rate as well. A green light produced 62 bubbles, red 100, and blue 54. The red light yielded the greatest photosynthetic rate, the green the second highest, and the blue the lowest photosynthetic rate.
A graphical illustration of this can be seen on page 10.
Absorption Spectrum of Chlorophyll
Both chlorophyll a and chlorophyll b's absorbance level increased and then decreased at both lower and higher wavelengths. The absorption spectrum of chlorophyll a is slightly greater than chlorophyll b for the most part.
A graphical illustration can be seen on page 11.
Discussion
Chromatography: Separation of Chloroplast Pigments from Spinach Leaves
The Rf values seem to decrease as we measure the pigments at the lower end of the filter paper, which makes sense.
The function of the chlorophyll pigment is to capture light energy. The most important chlorophyll pigment is chlorophyll a. This is the molecule which makes photosynthesis possible, by passing its energized electrons on to molecules which will manufacture sugars. All plants, algae, and cyanobacteria that photosynthesize contain chlorophyll a. A second kind of chlorophyll is chlorophyll "b", which occurs only in green algae and in plants. Carotenoids cannot transfer sunlight energy directly to the photosynthetic pathway, but must pass their absorbed energy to chlorophyll. They are called accessory pigments.
These pigments can be found in the thylakoid membrane of the chloroplast.
Effect of Light Intensity on Photosynthetic Rate
Based on the data, light intensity has a direct relationship with the photosynthetic rate.
The method of testing each light bulb wattage twice and taking an average might be considered to be a control, though it seems to me that no control was involved in this experiment. The variables were the different watt level bulbs, and in the case of the colored light, the different color shields.
Not all colors of light, or rather light wavelengths are equally effective at powering photosynthesis. The wavelengths that can be used are dependent on the absorption spectrum of the particular pigments used, but a generalized action spectrum for photosynthesis is shown on the next page, taken from: http://www.sidwell.edu/us/science/vlb5/Independent_Research_Projects/dwinik/index.html#hypothesis
This graph does not completely correlate with our experiment, in that the green light showed a greater photosynthetic rate than the blue light. This seems to be improbable, based on the characteristics of chlorophyll pigments. Because we tested the green light first, it may be that there were more bubbles simply because it was the only variable to have fresh sodium bicarbonate solution.
Absorption Spectrum of Chlorophyll
Though the sudden increasing and decreasing absorbency ratings at low wavelengths and at high wavelengths was vaguely confusing, the absorption spectrum of Chlorophyll a and b taken from our data correlated well with the usual credited results taken from this graph on the web page: http://utweb.utampa.edu/faculty/kbeach/lightharvesting/sld006.htm
The main differences were in the chlorophyll b readings.
As seen from the data, chlorophylls a and b differ slightly in the wavelengths of light that they absorb best. Carotenoids help fill in the gap by strongly absorbing green light.
References
http://www.sidwell.edu/us/science/vlb5/Independent_Research_Projects/dwinik/index.html#hypothesis
Copyright 2000, Daniel Winik.
Bungay, Henry R., BASIC Biochemical Engineering, BiLine Associates, 1993.
http://www.ultranet.com/~jkimball/BiologyPages/W/Welcome.html
Copyright 2002, John W. Kimball.
http://utweb.utampa.edu/faculty/kbeach/lightharvesting/sld006.htm
No copyright.
Johnson, George B., 1997. The Living World 2e. McGraw-Hill, Boston.
Spring Semester 2002. Biological Concepts: Laboratory Manual.
Framingham State College.