Table of the results:
If there was more time I could have repeated this work to make sure this information was reliable but I could not.
Analysis
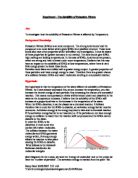
Look at the table and the graph above. These results were obtained by the experiment described. You can use the data and the graph to get some information about the solubility of ionic compounds in water. If a solid is soluble in a liquid, it usually gets more soluble as the temperature rises. The solubility that is in a high temperature is larger than another one, which is in a low temperature. Temperature will affect solubility. If the solution process absorbs energy then the solubility will be increased as the temperature is increased. If the solution process releases energy then the solubility will decrease with increasing temperature.
The solution may be saturated, but it likely is less than saturated. Only when some solid remains undissolved are you sure it is saturated. The presence of undissolved solid suggests that the solution is saturated. From the graph, 25 g KClO3 dissolve at 70 °C, and 50 g KClO3 dissolve at 96 °C.
The graph shows me that I can get different kinds of information about solubility of this solid in water.
1. I can get the solubility of KClO3 at any temperature. For example…..(use graph) This means I can get the solubility of KClO3 at any temperature.
2. The solubility at 20oC is … if I double this temperature to 40oC the solubility value is. This has not doubled in value. This shows that solubility is not proportional to rise in temperature. The solubility vs. temperature is a curve.
3. to show that solubility is not proportional to temperature I tried to get a straight line by making temperature = 1/T and use the equation y = mx + c. Where y = solubility and x = 1/T oC. I still got a curve. This proved my prediction.
4. The graph also shows me the temperature at which crystals will first appear if I cool the solution. For example …………………..
5. I can also get information about the mass of solid I can get when I cool the solution. If I cool from …… to ,I can get …………..of crystals will form. (use graph to give this information)
6. From the graph I can show that above the solubility line the solution is saturated and solid appears. A saturated solution is ….
Below the solubility line the solid is completely soluble and always exists as a solution.
(you may want to show all this information on your graph)
7. The results are for one set of readings. If time had allowed I could have repeated the work and obtained at least 3 sets of results and used the average. The results would have been more reliable. However, the solubility line I got gave me enough information to explain the solubility of solid in solvent.
8. If I had obtained the solubility of other salts I could also compare their saturation temperature and solubility with potassium chlorate.
Scientific explanation of solubility
Ionic compounds exist as giant ionic structures. There is a strong force of attraction between the opposite charged ions. A lot of energy is needed to break up this strong force
…..(explain how water breaks up the crystal structure and surrounds the ions and how the amount of solid in water affects its solubility. Use the ionic model from your notes..)
(Anya: you must try to interpret your graph. Explain the line and give information form the graph. I have tried to show you this by giving you all the points necessary. Please try to understand these points and write them in your own style, using your own words. Do not use my words but only be guided by them.)