- If the potato has a high surface area then more osmosis can occur because there are more places for the water to pass into the potato. Osmosis will happen quicker so the equilibrium will be reached faster. Mass has a similar effect to surface area on the rate of osmosis.
- If the mass of the potato core is less than the other cores then the osmosis equilibrium will be reaches faster. If the mass of the core is higher, then the equilibrium will be reached slower.
- If the type of potato used is different it could affect my results because different type do potato could have different cell concentrations.
Preliminary Work
I am going to do a run through of my following idea of a method for my experiment in order to check that it is correct and to determine the right volume of sodium chloride solution to use.
Preliminary Experiment Apparatus
- 1 large potato
- 6 boiling tubes
- 2 test tube racks
- 30cm³ of 0.0M sodium chloride (distilled water)
- 30cm³ of 0.2M sodium chloride
- 30cm³ of 0.4M sodium chloride
- 30cm³ of 0.6M sodium chloride
- 30cm³ of 0.8M sodium chloride
- 30cm³ of 1.0M sodium chloride
- ruler
- knife
- top pan balance
- tissue paper
- corer (5mm)
- plastic forceps
- measuring cylinder
- tile
- stopwatch
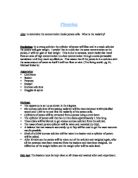
Preliminary Diagram
Sodium chloride solutions containing potato cores:
0.00M 0.20M 0.40M 0.60M 0.80M 1.00M
Preliminary Method
I will set up the apparatus as shown in the diagram. Using a 5mm corer I will cut six pieces of pieces of potato from the same potato. I will weigh the pieces of potato on a top pan balance and measure them with a ruler. I will cut them to be the same mass and length if they need it using the knife. I will put 30cm³ of each of the sodium chloride solution concentrations (0.0M, 0.2M, 0.4M, 0.6M, 0.8M, 1.0M) into each of the boiling tubes. I will put each piece of potato into each boiling tube and start the stopwatch. After 20 minutes I will take the pieces of potato out of the boiling tubes using the plastic forceps and dry them gently on a piece of tissue. I will reweigh and measure the pieces of potato recording the results in a table. I will put the potato back into their original solutions and leave them in the boiling tubes for another hour before re-weighing and measuring them. I will repeat the whole experiment again for reliability.
Preliminary Results
After doing this preliminary experiment I have realised that there are some parts of my method that I need to change. In the preliminary experiment I found that I only needed to use 20cm³ of sodium chloride solution to cover the potato. I will be writing on the boiling tubes the concentrations of the sodium chloride solutions to avoid confusion.
From these preliminary results I can tell the concentration of the potato cells is between 0.00M and 0.20M. This is because at 0.00M osmosis has taken place and the potato has gained mass and at 0.20M osmosis has taken place and the potato has lost mass. This means that between these two concentrations there is a point where osmosis doesn’t occur, the equilibrium.
This information can help me in the re-planning of my method. When taking my first set of results I will use the same concentrations as I have used in the preliminary work except the solution with concentration 1.00M. This is because my preliminary results have shown the concentration of the potato to be a long way from the concentration of 1.00M so it would be a waste of time to use it. I will also be using the concentrations of 0.05M, 0.10M and 0.15M. This will give me a more accurate idea about the concentration of the potato cells.
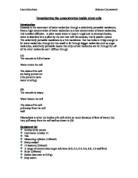
Another preliminary experiment that I carried out was with raisins and it showed me what happens to cells when they become turgid. I took a normal raisin and sketched a rough drawing of it. I then placed it in a dish of water and left it for 24 hours. I then took it out and drew the raisin with its new look. Here is the raisin before, and after:
Osmosis has taken place here because the sugar concentration inside the raisin is very high so water is taken on by osmosis to balance out the concentration gradient. The cell walls around the raisin cells prevent the raisin from bursting although it is very swollen.
Prediction: From looking at my preliminary results I predict the concentration of the potato cells to be between 0.00M and 0.2M.
Real Experiment
Apparatus
- 1 large potato
- 8 boiling tubes
- 2 test tube racks
- 20cm³ of 0.00M sodium chloride (distilled water)
- 20cm³ of 0.05M sodium chloride
- 20cm³ of 0.10M sodium chloride
- 20cm³ of 0.15M sodium chloride
- 20cm³ of 0.20M sodium chloride
- 20cm³ of 0.40M sodium chloride
- 20cm³ of 0.60M sodium chloride
- 20cm³ of 0.80M sodium chloride
- 30cm ruler
- knife
- top pan balance (reads to 2dp)
- tissue paper
- corer (5mm)
- plastic forceps
- 25cm³ measuring cylinder
- tile
- stopwatch
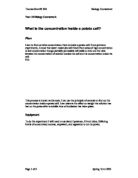
Diagram
Sodium chloride solutions containing potato cores:
0.00M 0.05M 0.10M 0.15M 0.20M 0.40M 0.60M
Method
I will set up the apparatus as shown in the diagram. Using a 5mm corer I will cut six cores of potato from the same potato. I will weigh the cores on a pan balance and measure them with a ruler. I will cut them to be the same mass and length if they need it using the knife. I will put 20cm³ of each of the sodium chloride solution concentrations (0.00M, 0.05M,0.10M,0.15M,0.20M, 0.40M, 0.60M, 0.80M) into each of the boiling tubes. I will make the 0.05M solution by adding 5cm³ of 0.20M solution to 15cm³ of distilled water. I will make the 0.10M solution by adding 10cm³ of 0.20M solution to 10cm³ of distilled water. I will make the 0.15M solution by adding 15cm³ of 0.20M solution to 5cm³ of distilled water.
I will put each potato core into each boiling tube and start the stopwatch. After 1hour and 10 minutes I will take the potato cores out of the boiling tubes using the plastic forceps and dry them gently on a piece of tissue to eliminate extra water that could effect the results. I will reweigh and measure the potato cores recording the results in a table.
Fair Test
I am varying the concentration of the sodium chloride solution and keeping the length and mass of the potato the same and keeping the amount of sodium chloride solution the same. I am keeping the length the same so surface area is equal. More surface area would mean that osmosis could happen faster. I am keeping the mass of the potato the same because if the mass of one core is less then osmosis will occur faster and vice versa. I am not changing the type of potato used the same either, because different types of potato could have different concentrations. I am weighing he potato and keeping the length the same because it is unfair to change more than one factor in one experiment. When re-weighing the potato I am drying it gently with a tissue to get rid of any excess salt solution from the potato so the mass isn’t affected.
I will be wearing a laboratory coat to carry out the experiment and I will be taking care in cutting the potato with the corer and the knife.
Results-(Anomalous results shown in yellow)
1st set
These results suggest that the concentration inside the potato cells is in between 0.00M and 0.05M. There are too many anomalous results in this 1st set so I will be not be using them when I make my final averages.
2nd set
These results suggest that the concentration of the potato is between 0.15M and 0.20M.
3rd set
I didn’t use the measurements for these results as I knew that I wouldn’t be using them to make conclusions.
The results suggest a concentration between 0.20M and 0.15M.
The measurements of length for all of the results do not seem to be particularly reliable so I won’t be using them to plot a graph. This might be because of the limited level of accuracy when using a ruler.
Percentage changes
Set 2
Set 3
Average percentage change :
I will plot a graph of percentage change against concentration of the sodium chloride solution and use it to work out the concentration inside the potato cells. This will be where the curve of best fit crosses the x-axis.
Analysing Evidence and Drawing Conclusions
My graph shows that the concentration inside the potato cells is 0.175M. This agrees with my prediction that the concentration would be between 0.00M and 0.20M. I can tell that 0.175M is the concentration of the potato because this is where my line crosses the x-axis showing no percentage change. Osmosis hasn’t occurred because there has been no change in mass. Therefore I can assume that osmosis hasn’t had to occur because the concentration between the potato and the sodium chloride solution are the same, the concentration gradient is balanced.
Only a couple of points are away from my line of best fit.
Evaluating Evidence
My experiment was a good one for finding out about the concentration inside potato cells because a set of results, showing a clear pattern have been produced.
My results are accurate because my mass readings are measured to 2 decimal places and they are measured in grams and not kilograms. My percentage changes are also measured to 2 decimal places. I used a stopwatch to time how long the cores were left in the sodium chloride which is more accurate than estimation. The precision of my results is good because I used a measuring cylinder to measure out the sodium chloride solutions and I checked the mass of the potato cores twice when weighing them on the top pan balance.
Two points are slightly away from my line of best fit and one result is anomalous in my table showing the 1st set of results (however this didn’t affect percentage changes). I may have these anomalous results because there was a difference in the surface area of the potato that was uncovered. This was because some potato cores had to be cut down to make their mass the same. A higher surface area would mean more osmosis could take place in a shorter time. Another reason to explain my anomalous results is that the accuracy in the concentrations of the sodium chloride may have differed on the days I did the experiment. The solution may have been made up wrongly before I started to use it.
My results are good enough to make a firm conclusion about the experiment because I did all I could to lessen the effects of factors such as mass and surface area on my results. I made sure that the mass wasn’t affected by excess sodium chloride solution by drying it with a piece of tissue before weighing it.
To improve my results I could take the temperature of the sodium chloride solution and take all my results on the same day so mistakes in the concentration of the sodium chloride are constant.
To extend this investigation further I could use more concentrations between 0.15M and 0.20M to check my result and be even more accurate. I could use different types of potato to see how their concentrations compare or I could use a different sized corer to cut the potato.