Results
Using: 20 cm³ 1 molar acid
10× red cabbage squares 1.5cm³
These results were obtained after leaving the red cabbage in the acid for two hours. I felt that this was too long, because the readings for Sulphuric and Nitric Acid were over 1.00, which gives an inaccurate reading. I therefore used these results to confirm that in my practical I will use Hydrochloric Acid of varying concentrations, and leave the red cabbage in solution for one hour, instead of two.
I also did a control tube – with the same amount of cabbage and volume solution, but using only distilled water. This was to show me that the acid was affecting the membrane and not the water in solution. The water had no effect, there was 0% absorption of light which shows the water has no effect, and I have not referred to it beyond this in my results.
After I decided to use Hydrochloric Acid, I did a second preliminary to explore the range of concentrations I should use. I prepared the following concentrations for the preliminary as follows:
- molar HCl used 20cm³ of 1M HCl, 0cm³ water
0.8 molar HCl used 16cm³ of 1M HCl, 4cm³ water
0.6 molar HCl used 12cm³ of 1M HCl, 8cm³ water
0.4 molar HCl used 8cm³ of 1M HCl, 12cm³ water
0.2 molar HCl used 4cm³ of 1M HCl, 16cm³ water
I then used 10 × 1.5cm³ red cabbage squared per boiling tube, with 20cm³ acid left for one hour. After the hour, I drained the solutions off the solids to ensure a clear solution to be used in the colourimeter. I again made a control cuvette with Hydrochloric Acid before doing my colourimeter readings.
These results show me that up to 1M HCl the pigment in the red cabbage is released. Although I could increase the concentration of acid, I think the results would not be useful as at 1.0M it is already at 90% absorption. Instead I will increase my readings by taking every 0.1M of acid.
Apparatus
- Hydrochloric acid 1.0 molar
- Cork borer 1.3mm diameter
- 10 boiling tubes
- knife
- white tile
- pipettes
- red cabbage
- marker pen
- colorimeter
- cuvettes
- test tube rack
- stopwatch
- distilled water
- measuring cylinders, (10cm³ and 25cm³)
- glass rod
- 250ml beaker
Choice of Equipment
Fair Test and Variables
In order to ensure it is a fair test, there are a number of control variables that must be kept at a strict constant in each test condition. In particular, it is crucial to ensure that:
- the size of the red cabbage layers are equal – use a cork borer to ensure equal sizes - red cabbage discs with a diameter of 1.3mm.
- the same amount of acid, 20cm³ is added to each test tube to eliminate inaccurate dilutions of the pigment which will alter the colorimeter readings
- light intensity (in the context of this environment, under weak electric light and for few hours, it is likely the light intensity will have little or no effect)
- the acid is at the same temperature ~21ºC (room temperature)
- each sample of acid should be left in the water for the same amount of time so proportional pigment is released
- use the same cabbage, and same leaves of cabbage
- repeat each reading three times to ensure accuracy and average any anomalies
- perform a control experiment, using distilled water to ensure the effect of acid on the cabbage
Method
- Using a cork borer with 1.3mm diameter, cut 100 discs of red cabbage.
- Put all the discs of cabbage in a beaker of distilled water for 3 minutes to wash off any pigment that has been released.
- Make up different concentrations of Hydrochloric acid using 1.0 molar acid and distilled water. I made up the concentrations as follows:
- 1.0 molar used 20cm³ HCl, 0cm³ water
- 0.9 molar used 18cm³ HCl, 2cm³ water
- 0.8 molar used 16cm³ HCl, 4cm³ water
- 0.7 molar used 14cm³ HCl, 6cm³ water
- 0.6 molar used 12cm³ HCl, 8cm³ water
- 0.5 molar used 10cm³ HCl, 10cm³ water
- 0.4 molar used 8cm³ HCl, 12cm³ water
- 0.3 molar used 6cm³ HCl, 14cm³ water
- 0.2 molar used 4cm³ HCl, 16cm³ water
- 0.1 molar used 2cm³ HCl, 18cm³ water
- Add 10 discs of cabbage into each boiling tube and leave for 1 hour.
- After 1 hour, collect the solutions off the cabbage pieces. In order to produce a control colorimeter reading, use a cuvette filled with pure HCl to get a reading of 0.00.
- Using a pipette, transfer the solutions into the cuvettes and place in the colorimeter.
- Ensure the colorimeter is recording the absorption of blue light, (frequency 470).
- Repeat the experiment three times to ensure accuracy and reliability in the experiment.
Safety:
- Standard laboratory safety followed – CLEAPSS for strong concentrations of acid
- contact with skin and eyes can cause damage and irritation– if contact occurs flush with water and remove any contaminated clothing. If swallowed drink plenty of water. Seek medical advice.
- Concentrated solutions are extremely corrosive, dilute concentrations are mildly corrosive
- Toxic when inhaled – hydrogen chloride vapour given off
- If diluted and flushed with sufficient water, HCl will not damage the natural environment.
As precaution, wear safety glasses when handling hydrochloric acid. Gloves could be used to protect against contact with the skin. The acid is best used in a well ventilated area.
- As a food plant, cabbage is not dangerous.
- Plant material – i.e. no sentient organisms involved
- No relevance of wild material
Results
Here is my data collectively shown, using arbitrary units.
From my results I was able to draw Graph No. 1 to show the correlation. However I felt that my results did not display a very strong correlation, and so I adapted my method. I felt that changing the acid by 0.1m each time was not sufficient, and so I decided to take acid readings of a multiple of 10 each time, for example, 1.0m, 0.1m, 0.01m etc. My method remained the same, and my results were as follows. I also recorded the percentage transmission (% Trans) of light in the colorimeter, as well as percentage absorption (% Abs). I found the average absorption and transmission by adding all three repeat values and dividing by 3, to get a mean average.
From these results I was able to draw Graph No. 2, which shows the percentage absorption and transmission of light.
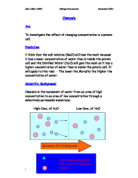
Discussion
Graph No.2 (log scale) clearly shows that as the concentration of hydrochloric acid increases, the percentage absorption of light increases, and the percentage transmission of light decreases.
At low concentrations, the percentage absorption of light increases at an increasing rate. From the molarity of approximately 0.0001 molar to approximately 0.1 molar acid, the graph increases sharply, until at ~0.1 molarity, the rate of increase greatly decreases. It seems that there are three sections to the absorption of light, where the molarity of the acid has different effects at different concentrations. All these results are a direct reflection of the transmission of light, and my discussion therefore applies to all results.
In the first section of the graph, from molarities 0.0000001 to 0.0001, there is a slow increase in the percentage absorption of light. This would indicate that at this point, the effects of the acid are minor, because of such a low concentration. There is little effect on the cell membrane causing only small amount of pigment to leak out into solution. Therefore, the solution remains fairly clear, and very little light is absorbed, i.e. from 0.5 to 1.8 %.
The second section of the graph, from approximately 0.001 molar to 0.1 molar, the rate of increase in light absorption is high. This would indicate that the most damage is done to the cell membrane between these molarities, causing more pigment to leak out and colour the solution, absorbing more light. This is because the concentration of hydrogen ions in the water is higher, and so more of the proteins in the plasma membrane are being damaged, causing large pores in the membrane to allow the pigment to leak out.
In the last section of the graph, from 0.1 molar to 1.0 molar hydrochloric acid, there is little increase in the percentage of light absorbed. This would indicate that the cell membrane is reaching its maximum damage from acid, or that all the pigment has now been released into solution and an increase in molarity could therefore not cause more pigment to leak out.
From these results, I can accept my hypothesis to be correct, and I can go on to explain a suggested mechanism for the degradation of the plasma membrane.
Red cabbage is an ideal substance to use in my experiment, because to define the extent of damage to the cell membrane, a pigment is needed to identify the leakage. Many dyes however, could themselves damage the membrane and I could then not test the effect of acid. Red cabbage is therefore ideal as it already contains a natural pigment which can identify the leakage and damage of the cell membrane, whilst not damaging the cell membrane itself.
The pigment found in the cabbage is known as an anthocyanin. Anthocyanins are water soluble pigments that are found in the vacuole of cells. If the cell membrane is damaged in some way, the pigment will be released out of the cell. By placing the cell membrane of a plant in acid, I think it will become damaged because of the proteins that span the phospholipids bilayer. Proteins are denatured at extremes of pH. In a higher pH solution, the concentration of hydrogen ions will be greater. This affects how the amino acids in the protein ionise, and in a high concentration of hydrogen ions the proteins will be likely to form positively charged cations. This charge can affect the proteins behaviour. Primarily, the charge will exert a repulsive force on the protein which will break the hydrogen and ionic bonds that hold the 3D shape of the protein. The protein then breaks up and its function is lost. Because the intrinsic proteins from the channels in the membrane, I think that as the proteins are denatured by the acid, and even larger pore is made which allows larger molecules such as the anthocyanins, to leak out, and colour the solution of acid the cabbage is in.
The pigment is made up of anthocyanins, the sugar free anthocyanins, and can be identified based on the structure of a large group of polymethine dye. In particular anthocyanins are derived from salts of the 2-phenylchromenylium cation.
The anthocyanins are coloured water soluble glycosides, with some or all of the sugar groups removed. The colour comes from a positive or negative charge distributed over the ring structure.
(http://icn2.umeche.maine.edu/newnav/NewNavigator/images/fruitjuicepic.gif)
I could suggest that my reading taken at 0.0001 is anomalous, although the result is not massively different or contradictory to the trend. I took three repeats which are sufficient to draw reliable conclusions, and I can therefore disregard this from the trend. If there was sufficient time in my experiment, I could perhaps have performed up to 5 repeats, which would have minimised the anomalies, but in the context of the experiment it was not practical to do so.
Evaluation
From my results, I can draw a clear curve through the data which allows me to be confident in my results. I have few anomalies, and my results appear consistent, and I am therefore positive I can use these results to support my hypothesis.
It seems that there was a very definite benefit from taking a wide range of concentrations, covering eight orders of magnitude. This sufficiently covered a wide range of pH that have any effect on the membrane.
I used error bars to show the range of results, which can be seen as a crude method that exaggerates the statistical error of the readings, compared to confidence limits which are statistically more meaningful and typically more informative. However, in Graph 2 the error bars I have drawn are relatively small, with one notable exception at 0.001 molar, and I can therefore have confidence in my results. My Graph 1 has large anomalies, indicating great variation in my results. However, if I take the maximum and minimum values, the same trend can be seen in these results, which can therefore support my hypothesis. Another way to minimise these error bars would be to take more readings to make my results more accurate and reliable.
The curve shows that most off the damage to the membrane occurs between the concentrations of 0.0001m and 0.1 molar, which I can refer to as the threshold range. This is the fastest phase of disintegration, and it is therefore unsurprising that this is where the large error bar occurs. If there is a variation in the results, it is likely to be within the threshold range, where most of the damage is taking place.
The main difficulty with my experiment was collecting enough cabbage discs of equal size to give me adequate results. I needed to take the discs from the same leaf of the cabbage to ensure accuracy, and this process was time consuming and delicate. However, my
data gave me a clear sigmoid shaped curve with results that can be explained my hypothesis and research. I am therefore confident in my methodology, because my results enabled me to prove my hypothesis.
I could perhaps have taken more repeat readings which would have minimised any slight anomalies, but I felt that taking eight orders of magnitude and repeating three times was more useful and valid than say, five orders of magnitude repeated five times, and indeed more practical in the time allowed.
Further Work
If I was to extent my research, I could firstly take more repeats to ensure the accuracy and reliability of my results. I could also perform a series of these experiments, but from different parts of the cabbage, for example discs from different leaves to give me more varied data to reach my conclusion from.
I could also carry out a similar experiment using beetroot and other naturally pigmented plants, to see if the damage to the cell membrane is comparable with other plants and therefore representative for all plant cell membranes.
The key region, of the threshold range, i.e. where most of the damage takes place and leakage is at a maximum, i.e. between 0.0001 and 0.1 molar, could be investigated further, firstly by taking more readings within that range.
After having damaged the membrane and obtained leakage, it might be interesting to see with appropriate microscopy (including electron microscopy) if there are notable differences in the structure of the cell membrane at different acidities, for example, simply a different physical appearance.