This experiment does not only consist of controlled variables but also uncontrolled variables will be present, as illustrated below:
Preliminary
This stage of my coursework was conducted to ensure that I chose the best and most accurate method for my actual experiment. The first preliminary experiment held, was to investigate the amount of alkali solution used. At first we used 20cm of sodium hydrogen carbonate however, we observed that once this was added to the milk, it would instantly denature the milk before the lipase and bile salts were even added. This lead me to believe that I needed to decrease the amount of sodium hydrogen carbonate used; as a result I began using 15cm of the chemical, nevertheless the same outcome was witnessed and the milk denatured. The cause of this may have been due to the sodium hydrogen carbonate itself which I found to be extremely alkali. An alternative explanation would be due to a large amount of sodium hydrogen carbonate used, therefore denaturing the milk prohibiting a reaction as the bile salt and lipase were unable to act on the lipids, which became evident as the pH did not drop or change from pH10. Consequently, I decided to use sodium carbonate which is not as alkali as the sodium hydrogen carbonate. Moreover, I decided that I did not require a large fixed volume of the chemical but in fact only droplets needed to be added until the pH reached to pH10, the amount of droplets varied in different experiments, this may have been due to the age of the sodium carbonate of perhaps a result of the particles settling in the solution.
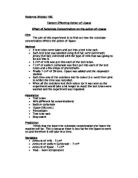
My second preliminary investigation was to acknowledge the affect of temperature on the rate of reaction allowing me to decide on the best temperature to use for the experiment, which will enable me with reliable and clear results. Enzymes work best at around 37˚C; this is because the molecules become excited as they receive more heat, thereby more kinetic energy forcing them to collide more frequently with the substrate. However, above the optimum temperature the enzyme will denature due to the breaking of bonds and therefore no reaction can be examined. As a result, I decided to monitor the effect of the temperature on the reaction of the experiment; I therefore compared the rate of reaction under 18˚C and 35˚C. Given below are the results obtained for these two temperatures:
From the data above it is clear that only a slight change in pH was experienced when the lipase and bile salt were heated to 18˚C.
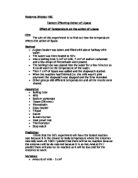
The table above indicates that once you increase the temperature, a greater decrease in pH will be shown. In this case once we increased the temperature from 18˚C to 35˚C the bile salt emulsified the lipids at a faster rate allowing the lipase to break them down at a quicker rate due an increase in collisions between the triglycerides and enzyme. Subsequently, I will heat my lipase and bile salt together at 35˚C in order to gain a greater decrease in pH implying a faster reaction on the break down of lipids.
The final preliminary experiment held, was to explore which chemical of substrate would be best to use. We firstly tested out full-fat milk (substrate) and added sodium carbonate and lipase and bile salt. From this we received acceptable results as there were sufficient lipids present for the lipase to act on. However, when we used full-fat cream, we obtained better results, as there were more fats present therefore more substrate which meant more frequent collisions between enzyme and substrate particles.
Preliminary method
For my preliminary method I will demonstrate how I conducted and prepared my practice investigation for the different temperatures of 18˚C and 35˚C:
- Prepare equipment neatly on a table. Attach labels on all apparatuses stating what each one contains to avoid confusion. Make sure all equipment is set out clearly and neatly.
- Before measuring out the chemicals you must shake the solutions well as occasionally the particles settle leading to inaccurate results. This can simply be done by shaking the beakers or flasks gently which contains the solutions ensuring nothing spills.
- Measure out 10ml of full fat cream using a pipette and add into a beaker labelled cream. You must ensure that you wash the pipette as it will be required once measuring other substances.
- Add sodium carbonate into beaker labelled sodium carbonate using a pipette; make sure the pipette has been washed out so that the sodium carbonate does not react with anything before the experiment begins, this will result in accurate and precise results.
- Measure out 10ml of lipase into test tube labelled lipase using pipette again make sure it has been rinsed out of any chemicals.
- measure out 10ml of bile salt containing a concentration of 3% (3% should be used as this is the median concentration of bile using pipette, and add test tube with label stating what it is.
- Boil some water in kettle then pour water into a large beaker (1000ml)
- Add test tube labelled lipase and bile salt into beaker and monitor with thermometer until they reach 18˚C.
- Now add lipase and bile with the cream in the beaker labelled cream.
- Place probe into the beaker of your mixture.
- Using a burette add drops of sodium carbonate into beaker, until pH reads 10.0pH.
- You are now ready to record your results:
- Immediately start recording your graph.
- Once the above has been maintained, and the graph is complete repeat the above steps but keep your test tubes containing lipase and 3% bile in the beaker until they reach 35˚C.
Apparatuses required
There are a number of equipments required in order to perform this is experiment, each apparatus possesses a specific job and is used as it enables the outcome of the most accurate and reliable results.
Chemicals required
- Distilled water.
- Sodium hydroxide.
- Lipase (enzyme).
- Full-fat cream, lipid (substrate).
- Bile salt.
Concentration of bile salt
Table two below, demonstrates how to maintain the different concentrations of bile salt, which is essential once conducting the experiment, in order to observe the affect of bile salt on the activity of lipase on lipids.
Table one:
Method
- Connect the data loggers onto the computer and the probe onto the data loggers, as shown in diagram 1.
- Pour distilled water into a beaker and place the probe inside however make sure the water is not near to the computer, for safety reasons.
- Prepare equipment neatly on a table (table must be away from the computer table). Attach labels on all apparatuses stating what each one contains to avoid confusion. Make sure all equipment is set out clearly and neatly.
- Before measuring out the chemicals you must shake the solutions well as occasionally the particles settle leading to inaccurate results. This can simply be done by shaking the beakers or flasks gently which contains the solutions ensuring nothing spills.
- Once the above has been carried out, ensure the probe is placed in distilled water, and then set the pH on the data logger ensuring it reads 7.0 pH as this is the pH of distilled water.
- Measure out 10ml of full fat cream using a pipette and add into a beaker labelled cream. You must ensure that you wash the pipette as it will be required once measuring other substances.
- Add sodium carbonate into beaker labelled sodium carbonate using a pipette; make sure the pipette has been washed out so that the sodium carbonate does not react with anything before the experiment begins, this will result in accurate and precise results.
- Measure out 10ml of lipase into test tube labelled lipase using pipette again make sure it has been rinsed out of any chemicals.
- Different concentration of the bile salt need to be used, this is maintained through dilution of 0, 1, 2, 3 percent, followed by a factor of 4 and finally a factor of 5, each bile salt concentration must be placed in a test tube with a label of the concentration to avoid confusion. (To understand more about how to achieve the varying concentrations refer to table one).
- Start with a factor of five of bile salt, measure out 10ml of bile salt using pipette, and add to test tube labelling the concentration of bile (in this case label ‘5% bile salt’).
- boil some water in kettle then pour water into a large beaker (1000ml)
- add test tube labelled lipase and bile salt into beaker and monitor with thermometer until they reach 35C
- Now add lipase and bile with the cream in the beaker labelled cream.
- Place probe into the beaker of your mixture.
- Using a burette add drops of sodium carbonate into beaker, until pH reads 10.0.
- you are now ready to record your results:
- Immediately start recording your graph, remember your probe has to remain in this beaker at all time, producing your results.
- Once the above has been maintained, and the graph is complete begin preparing the above with the varying concentrations of bile salt, add the results on the same graph in order to distinguish the difference.
Risk Assessment
The following rules must be carried out during the performance of the experiment to ensure it is safe:
- Hair must be tied back - to prevent hair from burning.
- Goggles must be worn at all times – for protection from any chemicals entering the eye.
- Wear a lab coat – to prevent your clothes from any damage in case any chemicals are spilt.
- Keep the experiment relatively away from the edge of the table and from you – so that nothing falls on the floor and breaks and nothing spills on you.
- Wear gloves at all time – to protect your hands from any chemicals such as lipase which is acidic and sodium carbonate which is very alkali.
- Clean all equipment with disinfectant when used and wipe table with disinfectant to affirm that if any chemicals were spilt they are not left.
- Organize table and label all beakers and test tubes clearly – to avoid any confusion as to what they may contain.
-
Handle sodium carbonate (Na2Co3) and lipase cautiously – if exposed to skin wash instantly.
- Ensure equipment is not placed next to the computers so that if any accidents were to take place it will not be next to the computers thereby avoiding lost work or computer crash.
Table of results
Demonstrated below are my results for each factor of bile salt and the mean figure for each concentration. By the end of each experiment, I obtained a reading for every second within five minutes. However, presenting the results of 300 seconds would seem irrelevant; therefore, I decided to illustrate my tables (shown below) with a reading every 30 seconds, this will provide an overall idea of how much the pH dropped throughout the entire investigation.
Table 2
Table 3
Table 4
Table 5
Table 6
Table 7
Analysis
When recording my results, I decided to present a reading every 30 seconds, until 5 minutes. This is to provide an overall analysis for the whole 5 minutes of my experiment, showing how often the pH dropped and by how much it fell in each concentration and in each trial. As shown in the tables above, I recorded the mean pH fall for every 30 seconds of every concentration enabling me to see the affect of the concentration of bile salt on the activity of lipase. I decided to keep and present all 3 trials to ensure that all my results are as accurate and as reliable as possible. In addition to this, I have also attached a graph (refer to graph 1) showing the average of each 30 seconds for the concentrations, this provides a visual comparison, which I may examine to see the relation between the time and pH in regards to each concentration of bile salt. From graph 1 we can see that as the concentration of bile increase the pH decreases, supporting earlier prediction because as you can see in 5% bile the at 120 seconds the pH drops to 7.9 this then continues to drop until 300 seconds were it reaches 7.2 pH this was the lowest reading obtained, thereby ensuring the higher the concentration of bile the lower the pH, this is further supported as in 0% bile (control) the pH did not drop vigorously compared to other concentrations between 90 to 270 seconds.
Demonstrated below (table 8) are the figures gained from the average pH decrease for each concentration. Between the factor of 0% and 1% there are no differences shown. The pH average fall then decreases in 2% concentration. This contradicts earlier prediction and also opposes my other results, which show that as the concentration of bile salt increases the average fall of pH decreases, the figure maintained for 2% is therefore an anomaly, reasons for this will be discussed in evaluation. When the concentration of bile salt was 3% the average fall increased to 2.2, this increase continued in concentration of 4% to 2.5, and finally in 5% to 2.8, this is because there is an increase in bile concentration therefore greater emulsification of triglycerides allowing the lipase to break the lipids down and as a result a greater drop in pH level. It is only 2% bile which shows to be anomalous as the remaining results prove that as long as you increase concentration of bile you increase average fall. Therefore, the majority of the results are correct and accurate, because they show that once the concentration of bile is increased, the solution becomes more affective, which is apparent as the increase of bile salt further increases the surface area of lipids, allowing the lipase to act on all the lipids and break the large molecules down into glycerol or fatty acids, as seen by the increase in the pH fall.
Table 8: Average pH drop
As a result of the above, we cannot argue that bile has no affect as we can clearly see, that at 0% there was little average decrease in pH as the level only dropped by 2, however, if compared to 5%, this fall in pH increased to 2.8, which proves that bile has an affect on the breakdown of fats in the cream. However, to further support this claim and gain clearer evidence of whether or not bile affects the activity of lipase, I have worked out the rate of reaction and gradient of each concentration on graphs 2, 3, 4, 5, 6, 7. The results obtained are illustrated in the table below:
Table 9: Rate of reaction
The above table shows that as the concentration increases the gradient increases, 0% shows that the gradient is 0.01 whereas at 5% the gradient increases to 0.03, highlighting the affect of bile on the behavior of lipase when digesting the lipids, as there is a greater rate of reaction, we can see that as you increase the bile concentration you increase the amount of fatty acids and glycerol formed, this can also be observed in graph 8: which shows that although the gradient does not increase in each concentration increase, for example from 4% to 5% it is constant and from 0% to 1% it is the same in addition from 2% to 3% the gradient remains the same, there is still a trend that as you increase concentration you increase gradient. Showing a positive correlation as the relationship is clearly demonstrated in the graph.
0.03-0.01=0.2
0.02 x 100% = 66.7%
0.03
The above equation shows that the rate of reaction increases by 66.7%, this supports my earlier prediction, proving that there is an affect in the presence of bile and the concentration of bile.
Paired t-test
The reason for why I will carry out my paired t-test is to further support my hypothesis. Furthermore, this will allow me to see how reliable my average drop in pH level is (table 8), and also whether or not my rate of reaction or gradient of the concentrations is accurate (table 9).
t= 3.20
degrees of freedom = 7
The probability of this result, assuming the null hypothesis, is 0.015
Group A: Number of items= 8
8.60 8.70 8.90 9.20 9.30 9.90 10.0 10.0
Mean = 9.32
95% confidence interval for Mean: 8.840 thru 9.810
Standard Deviation = 0.580
Hi = 10.0 Low = 8.60
Median = 9.25
Average Absolute Deviation from Median = 0.475
Group B: Number of items= 8
7.40 7.50 7.70 7.90 8.70 9.90 10.0 10.0
Mean = 8.64
95% confidence interval for Mean: 7.661 thru 9.614
Standard Deviation = 1.17
Hi = 10.0 Low = 7.40
Median = 8.30
Average Absolute Deviation from Median = 1.01
Group A-B: Number of items= 8
0.000E+00 0.000E+00 0.000E+00 0.600 1.20 1.20 1.20 1.30
Mean = 0.687
95% confidence interval for Mean: 0.1791 thru 1.196
Standard Deviation = 0.608
Hi = 1.30 Low = 0.000E+00
Median = 0.900
Average Absolute Deviation from Median = 0.537
The above information shows that my degree of freedom is 7, and t stands for 3.20. By using the t-table I can determine whether or not to reject my null hypothesis. As my t-value is greater than the critical figure 1.895 (maintained from the significance level 0.05, degree of freedom 7) I can reject the null hypothesis. This is a clear indication that my initial hypothesis is correct.
Conclusion As shown in table 8, initially there is no change between 0% and 1%, in 2% the affect of bile becomes unclear as we observe a decrease in the average drop not an increase. However, in concentrations 3%, 4% and 5%, we can see that bile does in fact has an affect, this is apparent as in 0% (no bile) the average drop was 2 however by 5% this increased to 2.8, showing a relatively high difference, and in turn highlighting that the presence of bile and the concentration of bile both have an affect on the activity of lipase as depicted by the amount in which the pH falls. Furthermore the rate of reaction indicates that as you increase the concentration of bile to 5% you increase the rate of reaction by 66.7%, thereby asserting the major role of bile in this experiment. Moreover, the paired t-test is essential as it provides fairly accurate results, which allowed me to reject my null hypothesis.
In conclusion, the above suggests that increasing the concentration of bile increases the activity of lipase, breaking down more triglycerides. This is because the higher the concentration of bile the greater the chance of bile colliding with the triglycerides therefore increasing the surface area of the lipids and also the rate in which they are emulsified, and in turn increasing the rate of which the lipase reacts on the larger surface area created by the bile, allowing the lipase to act on the fats more effectively. The bile salt increases the surface area of the triglycerides as it breaks the ester bonds formed between the glycerol molecule and the three fatty acid molecules this enabling the lipase to breakdown more fats which is evident from the increase drop in pH level found in my results. Furthermore, as the concentration of bile decreases, say to 1%, the rate of reaction drops and the pH level does not fall as dramatically as seen in 5% bile. This drop in the rate of reaction and the limited degree of the pH fall can be due to diluted bile (an increase in water volume), thereby a decrease in the concentration of bile.
Evaluation
For the final part of my coursework I will be discussing the factors that were responsible for anomalous results. Furthermore, I will state how they caused errors in the experiment and eventually try to obtain methods, in which I can improve the performance of my experiment, thereby obtaining more reliable and accurate results. In order to demonstrate this clearly I have constructed a table below discussing all the factors which caused error and how to avoid them if I repeated this investigation.
Table 10: Problems and solution of this investigation.
In addition to the above, the thermometer used to check the temperature of bile and lipase until they reached 35C may have also maintained a degree of error as presented below:
Thermometer: 0.5 x100 = 1.43%
35
The above means that the thermometer possessed a figure of 1.43% degree of error which means that the temperature may have dropped below 35C or rose above35C, this could have affected the rate of reaction, as if you increase the temperature you are providing an increase in heat energy thereby providing a greater kinetic energy forcing the particles to vibrate more rapidly increasing the chances of collision between substrate and lipase, thereby increasing the rate of reaction. Furthermore, if you decrease the temperature then the rate of reaction will drop due to less kinetic energy decreasing the likelihood of collision between the triglycerides and enzyme. As a result the reliability of the thermometer is limited, however only by 1.43% as this is the degree of error shown by the thermometer.
The pipette used also demonstrated to contain the degree of error when used for measuring as shown below:
±0.05 x100 = 0.5%
10ml
±0.05 x100 = 0.5%
10ml
±0.05 x100 = 0.5%
10ml
This means that it was not always 10ml of bile or lipase or cream measured, however the affect of the degree of error by the pipette is limited as shown above as it is only 0.5%, however as discussed in the table above, nevertheless there are other factors which derive from the use of the pipette as discussed in the table above. Moreover, I used the same amount of lipase, bile and cream to ensure my experiment was a fair testing, as there was the same amount of enzyme and substrate therefore enough enzyme particles to react with the substrate present.
Another crucial point which must be taken into account is the varying activities of bile and lipase as those I used in my experiment was almost definitely extracted from animal (pigs to be more precise). Since humans and animals vary in their body function this would have meant that the affects bile and lipase on my experiment would have been different if I had used bile and lipase maintained from a human source or another animal. Perhaps if the lipase was derived from another specie then it may have been more or less affective.
A final point to consider is the Colipase theory; from my research and the results obtained in my experiment it is evident that bile aids the activity of lipase, however, it also limits its optimum potential. The colipase theory explains that colipase allows the enzyme to continue and work at its best rate. Consequently, the rate of reaction will become faster and achieve more abundant collisions and interaction between substrate and enzyme. The lipase is strongly inhibited by bile salts, but is reactivated by colipase. Normally the active site of the lipase is covered by a "lid" however the presence of colipase allows this "lid" is opened thus the active site is exposed allowing lipids to bind. As a result the function of colipase is to bind the substrate and lipase in addition to providing conformational changes. The colipase often allows one enzyme to bind to the triglyceride and the other to the lipase.
Overall, my results are relatively reliable although the degree of accuracy can be argued. However, I was still able to gain good results which supported my earlier hypothesis, and also gain my conclusion. Nonetheless, if I were to repeat this experiment I must consider the factors stated above.
Bibliography
Mammalian physiology and behavior-by Mary Jones and Geoff Jones-2002
www.physics.csbsju.edu/cgi/bin/stats/paired_t-test