The effect of Exercise on Pulse rate
The effect of Exercise on Pulse rate
In this experiment I am going to be looking at how exercise affects the pulse rate of the body. By the end of the experiment I hope to have found a connection between exercise and how it affects the pulse rate (for example, does the pulse rated increase or decrease?). I will study this by taking a group of students and asking them to exercise for a short amount of time, taking their pulse before and after this exercise to find out if there is any change in the rate of it.
Hypothesis and Biological knowledge
The heart is a huge muscle found in the chest. The main use of the heart is to pump blood, which delivers oxygen, glucose and much-needed chemicals to other parts of the body.
The muscle making up the heart is called Cardiac muscle; this special muscle does not wear down as other muscle does in the body. This is because it has to constantly beat to keep us alive, so cannot die out and be replaced by new muscle. The cardiac muscle also has another difference to any other muscle that we find in places like our legs or arms, this is that it has it's own beat, moving to make the whole heart pump, this type of muscle is called myogenic muscle, which means (moves on it's own).
There are three sections to how the heart pumps. As the heart never stops pumping these three stages carry on in a circle.
Diastole is when the muscles of the heart relax. This allows oxygenated blood to rush in to the left atria and de-oxygenated blood in to the right atria. As the blood enters the atrium they swell and the pressure inside them increase.
Atria Systole - This process means the contraction of the atria. As the pressure in the atrium increases and more blood rushes in to it there is more and more pressure placed on the valves between the atria and the ventricles. Once the atrium are full the valves leading from the blood vessels delivering the oxygen close, not allowing anymore blood in to the heart. Once this happens the valves from the atrium to the ventricles open and the atria contract, pushing the blood through in to the ventricles. (The valve between the atria and ventricle on the left hand side of the heart is called the bicuspid valve, and on the right hand side it is called the tricuspid valve).
Ventricular Systole is the contraction of the ventricles. This happens once all the blood from the atrium have entered the ventricles and the bicuspid and tricuspid valves have closed, stopping the blood flowing backwards in to the atria again. Just as in the atrium the pressure inside the ventricles increases until the blood pushes open the semi-lunar valves and rushing out of the heart. Once the blood has been successfully pumped out of the heart the semi-lunar valves close very quickly, stopping the blood from flowing backwards in to the heart.
As the blood is pushed out of the heart it travels along arteries, towards the different parts of the body where it will be needed.
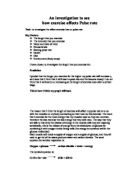
Arteries and veins are known as blood vessels, they carry blood around the body, centring around the heart and lungs. They are different in the way that they are made up, because they have different jobs.
(Reference: http://www.sci.sdsu.edu/class/bio590/pictures/lect5/artery-vein.jpeg)
Veins have thin walls; this is because the pressure in the veins is less than the arteries. Veins carry blood towards the heart and lungs; this means that it is coming from places in our bodies where the blood has been exchanging foods and energy. As it reaches these places the blood has to be forced through tiny blood vessels called capillaries, as this happens the pressure in the vessels builds up and energy is released, after the blood comes out of these capillaries the pressure is quite low as the energy has been used to push them through. As the pressure is so low the walls do not need to be very thick to withstand it, but they do have valves in them to stop the blood from flowing backwards on it's way back to the heart.
Arteries have much thicker wall than veins. This is because the pressure in them is much greater as they come straight from the heart, and the blood is being pumped very fast. Arteries come from the heart; they collect oxygenated blood from the lungs and deliver it to other parts of the body. The pressure in the arteries is so high because the blood has to be pumped all over the body, going down to our toes is easy as it follows the laws of gravity and falls, but it takes enormous effort for the blood to go ...
This is a preview of the whole essay
Arteries have much thicker wall than veins. This is because the pressure in them is much greater as they come straight from the heart, and the blood is being pumped very fast. Arteries come from the heart; they collect oxygenated blood from the lungs and deliver it to other parts of the body. The pressure in the arteries is so high because the blood has to be pumped all over the body, going down to our toes is easy as it follows the laws of gravity and falls, but it takes enormous effort for the blood to go uphill to out heads, so the pressure has to be high to pump it there.
Arteries are the blood vessels that we can feel our pulse by. Everywhere an artery crosses a bone we can feel our pulse, this is because the bone acts as a surface for the artery to press against. As this happens the shockwaves that are sent down the walls of the arteries from the heart can be felt, this is what we are feeling when we are looking for our pulse. The pulse rate is the amount of ripples along the artery walls; this shows how fast the heart is beating and pumping the blood around the body.
Inside the heart there are receptors, which are part of the nervous system these are connected to small systems called the cardio-acceleratory system and cardio-inhibitory centre. The cardio-acceleratory system responds to things picked up by the SA node in the heart, it is linked with the sympathetic nervous system and increases the working of the heart, causing it to beat faster. The cardio-inhibitory system also responds to the SA node in the heart, this time it's connected to the parasympathetic nervous system and decreases the work of the heart, thus decreasing the pulse and heart rate of the person. In my experiment I will be looking at how exercise affects the pulse rate of the individual. Whilst doing exercise there is an increase in respiration, this means that the amount of carbon dioxide in the blood will also increase as the oxygen is used up. This will mean that the PH of the blood will also increase; a swelling in the carotid artery called the carotid body will pick this up and send instructions to the cardio-acceleratory or inhibitory systems depending on which is needed to be used.
My hypothesis is that the pulse rates of the pupils will increase during and for a small while after exercise because of the need for more oxygen in the body. I then predict that the rate will lower after exercise as less respiration in the muscles is occurring and the blood is not needed to be pumped as fast.
In my experiment the cardiovascular system will provide the most important system. As the body uses up oxygen and sugars when it is working during exercise they will need to be replaced. The blood delivers the oxygen an other things needed in the respiration and working of the muscles to them, and as more of the oxygen and sugars will be used up during exercise this will mean that there should be an increase in the blood flow to these parts in the body. For this blood flow to take place the heart has to beat faster and pump harder to get the blood to the areas it's needed, this increase in heart activity will mean that the heart pumps the blood faster around the body. This blood will then pass faster through the arteries coming from the heart, therefore causing more ripples along their surfaces and an increase in the pulse rate as it is these ripples that we count to measure the pulse rate and how fast the heart is working.
From the biological knowledge and information that I have collected I predict that the pulse rates of the people I am using in my experiment will increase as they exercise. This will be because the heart has to pump quicker and more often to deliver sufficient oxygen to the areas that are working in the body, and keep them going.
As the heart pumps faster the blood is pumped around the body quicker, collecting oxygen from the lungs and taking it to where it's needed more often. So, as the heart pumps quicker the blood is pushed through the arteries faster, making more ripples from the heart and a faster pulse rate.
After the five minutes rest I expect the pulse rate to drop again, either back to what it was before if they are fit, if not then to drop to a lower rate that it was straight after exercise. This is because the heart will be slowing down again as the oxygen and energy isn't needed as much in the places that had been working so hard before.
Apparatus
* 2 Stop clocks - One to time the amount of time exercising, the other to time 5 minutes after they have stopped exercising.
* Step-up steps (1 block high) - To exercise on, for three minutes
* 6 pupils - To take pulse rate results from, before, after and five minutes after stopping exercise.
Method and Fair tests
* The pupil will have their resting pulse rate taken for a minute, (making sure that they have been standing up before hand, as this might also change their pulse rate).
* They will exercise (step-ups) for three minutes, trying to keep a constant pace.
* After the 3 minutes they will stop exercising and have their pulse rate taken straight away for another minute.
* They will wait (standing up) for a further 4 minutes (taking the resting time to 5 minutes).
* Will have their pulse rate taken once more for a minute to see if it has returned to its normal resting rate.
* The remaining pupils will take it in turns to do this experiment.
* I will repeat this experiment 3 times with each pupil, giving them sufficient time between the experiments to gain a normal resting pulse rate.
I will record my results in 'beats per minute' (BPM), as I am recording how many times the pupil's pulse is beating in a minute.
During this test I will have to think about how to make the tests fair, so there are things that I will make the pupils all do before and during the experiment. I will also make sure that there are things that I make sure are the same as to how I conduct the experiment. For the pupils I will make sure that they all are wearing the same clothes (which will be their school uniform) to make sure that they all are working under the same conditions, such as how their temperature increases, but also make sure that they all do the exercise with no shoes on as this may also affect the amount of energy that they need to do the exercise.
One of the things that I will be keeping the same is where and how I take their pulse. This is because it could be slightly different in each part of the body. I have decided to take it using the artery in the neck called the coronary artery, as this is probably the easiest place to find the pulse quickly. I will also try to keep the same equipment for the whole of the experiment, as a change in it may also provide a change in the results I get from the pupil's pulses. For example, if I changed the height of the step-up-steps for one of the pupils they would be using a different amount of energy to step-up, as the height would be different.
I have to understand also that my results will not be totally fair. This is because there are some variables that I will not be able to keep the same, these are things such as how hard I press on the artery or the accuracy of my counting, and when I start counting. I am going to try to keep these as fair as possible, doing things such as using the timer to help me keep time of how long I have been taking their pulse for, and being ready to take their pulse straight away after they have stopped exercising and after the five minutes rest.
Implementing
I did my experiment three times; this was to make sure that the results that I got for it would be as accurate as possible. If I was going to do this experiment well then I would be using people of exactly the same height and body mass, to make sure that I get perfect results, as I could not do this then I had to re-test my pupils to give room for any abnormalities that there might have been.
Experiment 1
Name
Resting pulse rate (Bpm)
Pulse rate after exercise (Bpm)
Pulse rate after 5 mins (Bpm)
Katherine Weller
80
60
96
2
Charlotte Smith
92
80
92
3
Naomi Augustine
82
26
04
4
Holly Gash
70
20
98
5
Sarah Mahoney
76
34
10
6
Eliza Wells
80
36
93
Experiment 2
Name
Resting pulse rate (Bpm)
Pulse rate after exercise (Bpm)
Pulse rate after 5 mins (Bpm)
Katherine Weller
81
62
90
2
Charlotte Smith
92
84
90
3
Naomi Augustine
80
22
08
4
Holly Gash
70
25
00
5
Sarah Mahoney
76
33
94
6
Eliza Wells
84
36
86
Experiment 3
Name
Resting pulse rate (Bpm)
Pulse rate after exercise (Bpm)
Pulse rate after 5 mins (Bpm)
Katherine Weller
80
58
94
2
Charlotte Smith
94
81
92
3
Naomi Augustine
82
30
05
4
Holly Gash
70
18
99
5
Sarah Mahoney
77
34
12
6
Eliza Wells
81
35
91
During my experiments I changed a few things to make it easier for me to study the temperatures of the pupils, and make it easier for them to do their exercise. When I originally set up my experiment I did it so that the pupils were exercising on their own. Whilst doing my experiment I found that I was running out of time, because of this I changed how I had set up my experiment so that Eliza was exercising whilst Sarah was having her rest after exercising. Although this was only a subtle change in how I carried out my experiment but it may have had an effect on the results, making them less accurate as the ones of Katherine, Charlotte, Naomi and Holly. This would be because I might not have paid as much attention to how I was counting Sarah's pulse rate, as I had to also make sure that I was ready to take Eliza's once she 'd finished her exercise.
Once I'd finished my experiment I put my results in to graphs for each person. Looking at these graphs I decided that I should have taken their temperature for every minute after they had stopped their exercise as this might have given a better graph, showing a curve of how their pulse rates decreased once they'd stopped exercising
Analysing
I did my experiment three times and got three sets of results. From these three sets of results I made another set of results, which are the averages.
Name
Resting pulse rate (Bpm)
Pulse rate after exercise (Bpm)
Pulse rate after 5 mins (Bpm)
Katherine Weller
80.3
60
93.3
2
Charlotte Smith
92.7
81.7
91.3
3
Naomi Augustine
81.3
26
05.7
4
Holly Gash
70
21
99
5
Sarah Mahoney
76.3
33.7
05.3
6
Eliza Wells
81.7
35.7
90
Looking at these results it is quite easy to see that the pulse rates of the students rose when they had been exercising for 3 minutes. For example, Sarah's pulse rate before she started exercising was an average of 76.3 beats per minute. After three intensive minutes of exercise I took her pulse again, this time it had risen to an average of 133.7 beats per minute. This gave an average increase of 54.4 beats per minute. After resting for five minutes I found that Sarah's pulse rate fell by 28.4 beats per Minute, this also held up my prediction as I said that the pulse would probably fall after stopping for rest as the heart will not need to work as hard. When I looked at Naomi's results I found the same pattern, an increase of the pulse rate just after she'd stopped exercising (by averagely 100.4 beats per minute) and a decrease after five minutes rest (by averagely 76 beats per minute) this is because the heart is not having to work as hard as it needed to during exercise.
Evaluation
I think my experiment went very well. I was able to prove my prediction from what the results showed, and I was able to take fairly accurate results through keeping my fair tests and safety precautions. Although I didn't have any anomalies in my results there was something which I found interesting, Sarah has asthma which gets gradually worse when she exercises, I expected this to affect her pulse rate making it increase a lot more than the others once she'd finished exercising. When I worked out their average increases after exercise I found that this wasn't what I found, in fact many of the other pupil's results were a lot higher in their increase than Sarah's. This is a possible abnormality as I was expecting to find that Sarah's pulse would rise higher than the others, there could be a few possible reasons for this not being the case, one of these is that her asthma is not invoked by exercise, rather by some other factor such as a dust allergy or hay fever.
All of the pupils that I tested were of different heights and weights; this means that they all will have different ways in which their bodies will cope with the exercise, giving different increases and decreases in their pulse rates. If I were doing this experiment again I would have someone to help me with the timings, as I found it very hard to watch the stop clocks and count the pulse at the same time. Another thing that I could have done differently to gain better results would be to have taken more results, possibly every minute. This would mean that I would have more of accurate graphs and would see how the rates changed more clearly.
Research Sources:
Picture of veins/arteries
http://www.sci.sdsu.edu/class/bio590/pictures/lect5/artery-vein.jpeg
Picture of the heart
http://www.savannahcardiology.com/images/heart_diagram.jpg
Information for Biological Knowledge
http://health.yahoo.com/health/encyclopedia/a.html
http://www.smm.org/heart/lessons/lesson1.htm
Microsoft Encarta 99
Name: Heinemann AVCE: Health and Social Care Student Book
Author(s): Neil Moonie ISBN: 0 435 45589 3
Name: Heinemann GNVQ Advanced Health and Social Care
Author(s): Neil Moonie ISBN: 0 435 45253 3
Name: Hodder Vocational A-level Health and Social Care
Author(s): Hillary Thomson, Sylvia Aslangul, Caroline Holden, Carolyn Meggit ISBN: 0 340 77547 5
Name: Understanding Biology, for advanced level (third edition)
Author(s): Glenn and Susan Toole ISBN: 0 7487 1718 8