Results and analysis
- Record the results in a table.
- Draw a bar graph of the germination percentage at differing salt concentrations for each seed variety.
- What effect does salt have on seed germination? Explain.
- How did the two kinds of seeds differ in their response to the salt solution? Point out any differences between them.
- What are the implications for farmers in salt-affected areas?
The effect of salinity on plant growth
Materials
- Ruler
- Fast-growing plants that have reached an advanced stage of germination (e.g. beans, sunflower)
- Coarse washed sand
- 5 plastic plant pots (15 cm in diameter)
- Measuring cylinders
- Beakers
- 20 litres non-saline nutrient solution (‘Aquasol’ or similar, mixed as per instructions; ensure micro-nutrients are included)
- Dropper bottles containing 5 salt/nutrient solutions at the following concentrations:
- nutrient solution only (control)
- 0.25 grams salt per litre nutrient solution
- 0.50 grams salt per litre nutrient solution
- 1.0 grams salt per litre nutrient solution
- 2.0 grams salt per litre nutrient solution
- Foil
Method
- Place plants in coarse washed sand, with four plants in each plant pot.
- Make up the salt/nutrient solutions as described above.
- Irrigate each of the pots, when necessary, from the top of the sand and let excess solution drain away through the bottom of the pot. To save on solution you can grow the plants in beakers of solution and change the solution once a week — the plants will deplete the solution of some of the elements over that time and it needs to be replaced. If growing plants in solution, it will be essential to provide aeration to roots. Use an air pump (e.g. fish tank aerator per beaker). The beakers of solution need to be wrapped (e.g. in foil) to keep the roots dark.
- Carefully measure the amounts of solution added to, and the amounts of drainage from, each pot over the next 3 weeks. Measure plant growth (height of stem above soil) at regular intervals. Note events such as appearance of new leaves, and any strange symptoms on any leaves. Use table 1 to record your observations.
- At the end of 2—3 weeks, when obvious differences have occurred in the treatment plants, harvest the trial and dry and weigh the shoots.
Results and analysis
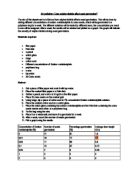
Table 1
I = in (mL solution added) O = out (mL solution drainage)
- Describe your results.
- Is there a relationship between the amount of water used and the salinity of the solution? Explain.
- Plot on separate graphs:
- the harvested dry mass (relative yield) against salinity
- the stem height against salinity.