I will keep these factors the same to ensure that the only altering factor is the light intensity, and so if I do experience any changes in the rate of photosynthesis I can safely assume that it is due to the lack/gain in light intensity.
- To monitor the temperature of the water bath I shall use a thermometer to make sure that it is not heating up.
- I shall monitor the time by using a stop clock.
Apparatus: In this experiment I shall use the following equipment:
- Beaker – to act as a water bath.
- Test tube – to hold the plant.
- Aquatic plant.
- Sodium Bicarbonate – to add extra Carbon Dioxide to the water to help the plant photosynthesise.
- Lamp.
- 100 watt light bulb.
- Meter ruler.
- Stop clock.
- Syringe (1mm² scale) – to collect and accurately read the amount of oxygen produced.
- Clamp – to block off the end of the syringe.
- Thermometer.
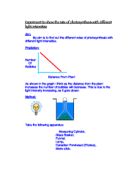
Diagram:
Preliminary Experiment: Before the actual experiment is performed, a test is necessary to ascertain details that are otherwise unknown (eg distances, times etc).
Having done a preliminary experiment, I have obtained the following results that will help me in the actual experiment:
Distances
After having tested distances from 5cm to 50 cm (with 5cm gaps in between) I have decided that it would be best to use distances 10cm to 50cm (with 10 cm gaps in between), as I have found these to range from good photosynthesis to hardly any photosynthesis, and I believe these would produce interesting results when given more time.
Times
During the testing for distances I was unable to give the plant much time to photosynthesise, but afterwards I found time to test different times ranging from 1 minute to 4 minutes, and I found that 2 minutes was appropriate, as it gave enough time to measure the plants progress at each distance, but also allows us to complete the experiment in one lesson.
Oxygen collection and calculation method
Out of the two methods available to us (either collecting the oxygen in a syringe OR counting the bubbles), I found that the best method (and the one we will be using) is to collect the oxygen in a syringe, as it is much more accurate than counting bubbles, and will therefore allow us to be more confident in our results, as we can believe them to be reasonably more reliable than those which would be collected from counting bubbles.
I have not needed to modify my plans for the experiment, as these results are more of less the same as I expected.
Method: Firstly, the apparatus should be set up as in the diagram above, ensuring that sodium bicarbonate has been added to the water, and that all gas has been expelled from the syringe. (Note that the plant should only be removed from the light where it is kept to where the apparatus is set up when the experiment is completely ready to begin, otherwise it may stop photosynthesizing).
The plant should be placed in front of the light (which should be set up at the first distance), the syringe placed onto the top of the plant and the timer started.
After the pre-determined time is complete, the amount of oxygen collected should be recorded, the plant moved to the second distance and the timer started again.
This should be repeated for the five different distances, and the entire experiment should be repeated three to five times and the averages taken to ensure accurate results.
Obtaining
Results:
Analysing
Analysis:
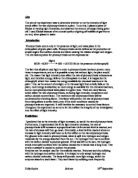
Above is a graph showing the average results from the experiment.
Unfortunately, a scientist could not be completely confident with these results, as they do not seem as accurate as was hoped. However, my results do prove that (apart from any anomalous results which break the trend), photosynthesis does in fact decrease as the light intensity is less.
This happened because a plant is unable to photosynthesise properly if it does not receive all the ‘ingredients’ it needs. As light is a very important ‘ingredient’, it needs a lot of it, and therefore if it does not get the right amount, or an amount it is not accustomed to it will not photosynthesis as well as it could/would with a higher amount of light.
In my prediction I hypothesised that when the light intensity was decreased, photosynthesis in the plant would decrease accordingly. After having completed the experiment, I have found that, apart from any anomalous results, the results did more or less match my prediction. However, the amount of photosynthesis did not decrease by equal amounts each time, but instead decreased randomly. This could have been because the plant did not start photosynthesising straight away, or it may not even usually photosynthesise at the same rate all the time, but may instead photosynthesise in bursts, causing fluctuations in the results.
Evaluating
-
The circled point (the highest on the graph) must be anomalous, as it should follow the trend and therefore be lower than the previous points, but it is much higher. This is probably because it was only at this point that the plant started photosynthesising fully, and therefore gave a sharp ‘burst’ of oxygen, or it could simply be a ‘bad’ result (ie it was read incorrectly).
Unfortunately in this experiment there were a few sources of error, as it is virtually impossible to complete an experiment without any. These were:
- The accuracy of the time measurement.
To make the experiment completely accurate, a more ‘advanced’ method of timing should be used, as using a stopwatch with just minutes and seconds would not be accurate, and could allow extra bubbles into the tube, which would harm the final results.
- The accuracy of how the oxygen was measured.
Although a syringe with a 1cm ³ was used, it would still not be completely accurate, as the exact measurement would be hard to read.
To get a more accurate average, the experiment could have been replicated a few more times (maybe five), to give a better chance of avoiding anomalies.
Also, between the different distances, it would have been a good idea to give the plant thirty seconds to a minute for the plant to start photosynthesizing properly, and to make sure that no extra oxygen from the previous light intensity was carried forward before the new light intensity measurement was commenced.
To extend my investigation I could try one of the following to get a more comprehensive set of results:
- Investigate the effects of different coloured lights at different light intensities on a plant.
- Investigate the rate of photosynthesis with a wider range of light intensities.
- I could use many different types of plants and investigate whether the effects are the same with different species of plants.