Plan
Sucrose sugar solutions of different molarities (10%, 20%, 25%, 30%)
Distilled water
Potato
Heat proof mat
Core Baller with 1cm diameter.
Scalpel
Test tube rack
Test tube
Measuring cylinder
Electronic scales
Firstly I shall gather all my equipment. Then, I shall take an average sized potato and use the core baller to cut out 6 equal width potato pieces on a heat proof mat. I shall then use a scalpel to cut the pieces into even lengths. I’ve identified in my preliminary investigation that the width of 1cm produces the optimum results as there is the biggest difference in the start and finish weight.
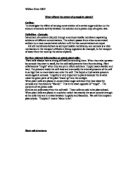
Table showing results of preliminary investigation using 5% sucrose solution
Using a scalpel, I shall cut each potato to a length of 3cm, cutting both ends straight in order to maintain the same surface area on each potato. To maintain the safety aspect in my experiment, I shall take precaution when using the scalpel and shall use it on heat proof mat in order to prevent the slipping of the knife. I shall then weigh each individual potato on electronic scales and shall then record the masses of the potato in a table. I shall then produce sucrose solutions of different molarities. I shall take a test tube rack and place 6 test tubes labelled 0%, 5%, 10%, 15%, 20% and 25%. Using a measuring cylinder I shall then measure out the different amounts of solution and distilled water:
- 0% - I shall use 40cm³ of distilled water
- 5% - I shall use 20cm³ of distilled water and 20cm³ of 10% sucrose solution
- 10% - I shall use 40cm³ of 10% sucrose solution
- 15% - I shall use 20cm³ of distilled water and 20cm³ of 10% sucrose solution
- 20% - I shall use 40cm³ of 20% sucrose solution
- 25% - I shall use 40cm³ of 25% sucrose solution
- 30% - I shall use 40cm³ of 30% sucrose solution
I shall then pour the solutions into the correctly labelled test tubes. After that, I shall place the potato model cells into the test tubes and leave it for 24 hours. After a 24 hour period I shall take out the potato pieces and shall dry them on the paper towels. Then, I shall weigh the potatoes on the electronic scale and shall record the mass and the consequent weight/loss gain of the potato.
In order to increase the reliability of my results, I shall therefore repeat the following instructions two more times and shall then identify any anomalies and average out the results.
Results
Table showing the loss and gain of potato weight in solutions of different concentration
I shall now use the following table to plot the results on a graph in order to analyse their reliability and the overall outcome of the experiment.
Analysis
By studying the graph shown above, which shows the line of best fit for the percentage change in the mass, it is evident that the concentration of the sucrose solution and the weight gain of the potato is not directly proportional to the each other because the line of best fit is not straight and does not go through the origin. However, as the concentration of the solution increases, so does the weight loss of the potato and this therefore shows that the weight loss/gain is inversely proportional to the concentration of the sucrose solution.
From the graph shown above, the concentration of sucrose solution needed to reach an isotonic point can be calculated by looking at what concentration did the potato neither increase nor decrease in mass. The estimated concentration of the isotonic solution is therefore 8% and this where there is the same concentration of solute as the cell and where the water molecules diffuse out the cell at the same rate resulting in change in mass.
My hypothesis for this investigation was correct. By placing the potato cell in high concentration of sucrose solution, the potato’s mass decreased. This is due to osmosis being the passage of water molecules through a selectively permeable membrane from a region of high water concentration to a region of low water concentration until a state of equilibrium is reached. Therefore when I placed the model potato into a hypertonic solution, there was a higher concentration of solute in the solution in relation to the cell and hence a lower concentration of water. This therefore caused water to diffuse out of the cell and cause the cell to loose mass and become flaccid. As the concentration of the solution increased further, the graph’s gradient decreased. This is due to the cells becoming as flaccid or as plasmolysed as they can and therefore the difference between the weight loss/gain of the results decreasing.
Conversely, by placing the model potato into a low concentration of sucrose solution, the mass of the potato increased. This is because when I placed the model potato into a hypotonic solution, there was a lower concentration of solute in the solution in the cell and hence a higher concentration of water. This therefore caused the water molecules to diffuse out of the solution and into the cell and caused the cell to gain mass and turgor pressure.
Evaluation
In my opinion, the experiment was very successful. Studying the graph with the line of best fit, it is obvious that the results are accurate since they are all close to the line and there is nearly a perfect curve. After studying the error graph it is evident that most of the recorded results have a high reliability because of the similarity between them. It also evident that the results contain an anomaly which could have been caused by several factors, either a misreading of the scales, not drying the potato thoroughly enough, the potato not being cut straight, not checking that the scales are at zero to start with, not drying the test tube or not using a correct concentration of sucrose solution.
We repeated the experiment 3 times and therefore were able to average out the results to increase the reliability. We used a wide range of results ranging from 0% to 25%. If we were to use higher values in our investigation, then the pattern would not have carried on since the cells would either reach the saturation point or would become fully plasmolysed.
In my initial experiment I failed to control some of the variables. Since we didn’t cut all the potatoes straight with a sharp knife, the surface area of the potatoes could have varied and affected the results. As well as that, the room temperature kept alternating and therefore meant that the temperature variable could not be controlled. We also didn’t make sure that the equipment was dry before use and this could have affected osmosis by diluting the concentration. As well as that, some of the water could have evaporated and made the solution more concentrated.
To improve the overall accuracy and reliability of my experiment I would alter the method of the investigation. In order to control the surface area, I would have to cut the potato horizontally with a sharp knife or would have to use a machine to cut the potato chips into equal lengths and widths. In order to keep the surrounding temperature constant in my experiment, I would place the solutions and potato chips into the fridge. To make sure that the concentration of the solution remained the same, I would dry all the equipment thoroughly and would cover up the test tubes with cling film in order to prevent evaporation. I would also increase the amounts of different concentrations used so I would have more varied results and a more accurate isotonic point. As well as that, the measurement of the solutions could have been more accurate by using a burette to determine volume. The accuracy of the potato weight could also be improved by using digital scales to several decimal places.
In conclusion, the investigation has shown me that by placing the potato into a concentrated solution the mass of the potato decreases, whereas by placing the model potato cell into a dilute solution, the mass of the potato increase. To further extend my investigation, I could test another variable and investigate its affects on osmosis in a model potato cell. For example, I could test the affect of the temperature or length of potato on osmosis