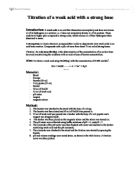
Diagram
Method
Part A
- An amount of Approximately 1.325g of anhydrous sodium carbonate was weighed and its mass recorded
-
The anhydrous sodium carbonate was then dissolved in a small amount of deionized water and was transferred to a 250 cm3 volumetric flask using a small funnel.
- Using small amounts of deionized water, any residual sodium carbonate solution was washed into the flask. This was done three times.
- Additional deionized water was added to a third of the volumetric flask and the stopped was applied and the flask was shaken to dissolve any remaining anhydrous sodium hydroxide solution.
-
An additional 100 cm3 of deionized water was added and was mixed thoroughly
-
The flask was then filled with deionized water up to the 250 cm3 mark
Part B
-
The 20 cm3 pipette was rinsed with sodium carbonate solution from part A. then 20.00 cm3 of sodium carbonate solution was transferred through the pipette into a 100 cm3 conical flask
- 2 drops of methyl orange indicator was added to the conical flask
-
The 50 cm3 Burette was rinsed with approximately 0.1 mol hydrochloric solution then was filled with hydrochloric acid
-
The initial burette reading was recorded to the nearest 0.02 cm3
-
Hydrochloric acid was titrated against the indicated sodium carbonate solution until a color change from yellow to orange occurs. The final burette reading was recorded to the nearest 0.02 cm3
- This experiment was identically repeated until three concordant results were obtained
Safety
- A lab coat must be worn when performing this experiment to reduce exposure to any chemical splashes
Data Collection
Concentration of HCl solution = 0.108 mol·dm3
Uncertainties
- Burette ±0.02
- Pipette ±0.06
- Scale ±0.001
- Titre ±0.04
Amount of Anhydrous Sodium Carbonate weighed = 1.325 ±0.001
Amount of Sodium Carbonate solution used = 20 cm3
Physical observations:
Part A
- When the anhydrous sodium carbonate was mixed with the deionized water, we saw no color change in the water and the sodium carbonate dissolved completely
Part B
- The sodium carbonate solution was clear, when the indicator was added it became a strong yellow color
- When the hydrochloric acid was added the color slowly changed from yellow to an apricot-like orange
- When access Hydrochloric acid was added, the solution turned pin
Figure 1
Figure 2
Data Processing
The total amount of HCl used was: 159.74 cm3 ±0.32cm3
The average volume of Hydrochloric acid used is calculated as:
±0.32cm3
Due to the observance of a wide spread area of results, I have selected three close results to be more accurate in my calculations. I have selected the highlighted pieces of data from figure 1
The revised average is:
±0.12 cm3
To convert this to dm3 we divide by 1000, = 0.01846 dm3
To calculate the moles I will use the formula:
=0.0125 mols
I will find the concentration of sodium carbonate
=0.05 mol dm-3
Knowing that this equation is a one to one ratio I can assume that 0.05 mol of sodium carbonate will react with the same number of mols of HCl.
The HCl titre of NaCO3 will be calculated using:
dm3
I will multiply this by 2 as for every sodium carbonate molecule reacted, I will have 2 Hydrochloric acid molecules. This will give me the moles of HCl
To find the concentration I will use the formula
The percentage difference is calculated as:
The total uncertainty in the whole of Part A and B is:
Scale x1
selected pipette x3
Titre x3
The percentage uncertainty of each piece of equipment is
Scale:
Pipette:
Titre:
Total percentage uncertainty is:
The absolute uncertainty for the concentration is:
-3
Conclusion
The aim of the experiment is to calculate the unknown concentration of HCl through titration using a strong-acid and a weak-base. The calculated result for the concentration of the HCl is 0.149 ±0.010 mols dm-3. This experiment works on the theory that when the correct amount of acid is added to a base to neutralize it, the pH will be equal to 7, and a color change will occur with an indicator. The percentage difference between my results and the expected results (given by the teacher) is 0.00%.
Evaluation
In order to decrease any possible error, we have repeated the experiment 8 times in total. Through calculations, we have found that it was the scale that gave us the highest error percentage, thus causing a high overall uncertainty. Any error that may have been caused when we were transferring the sodium carbonate to the conical flask, as a too much or too little amount may have been taken causing the results to fluctuate. Another reason that there may have been an inaccuracy could have been because of human error in reading the scale wrong, for example reading above the meniscus instead of below it. Parallax error is also a possibility; this would cause the calculations and results to fluctuate. Systematic errors such as not zeroing the scale correctly could lead to significant fluctuations in the measurements, or slight inaccuracies to a more accurate reading. However, in this case, there was no percentage error in the results.
Improving the experiment
Although the results had 0% error, the experiment could be further improved my using a more accurate and reliable way to measure the volume of the HCl that was released by using possibly an electronic measuring device that would be more accurate in reading the scale. The random error can be minimized by performing the experiment a larger amount of times and selecting the best results to average. Another way to improve the experiment, would be to use an electronic magnetic stirrer to stir the substance whilst the titration is occurring to gain a more accurate time for stopping as the reaction will occur much faster due to the continuous constant motion of the stirrer.
The best way to fix this type of error is to obtain more accurate scales to measure the substances. Or to have a data logger, with a pH probe to gain accurate readings for the neutralization.